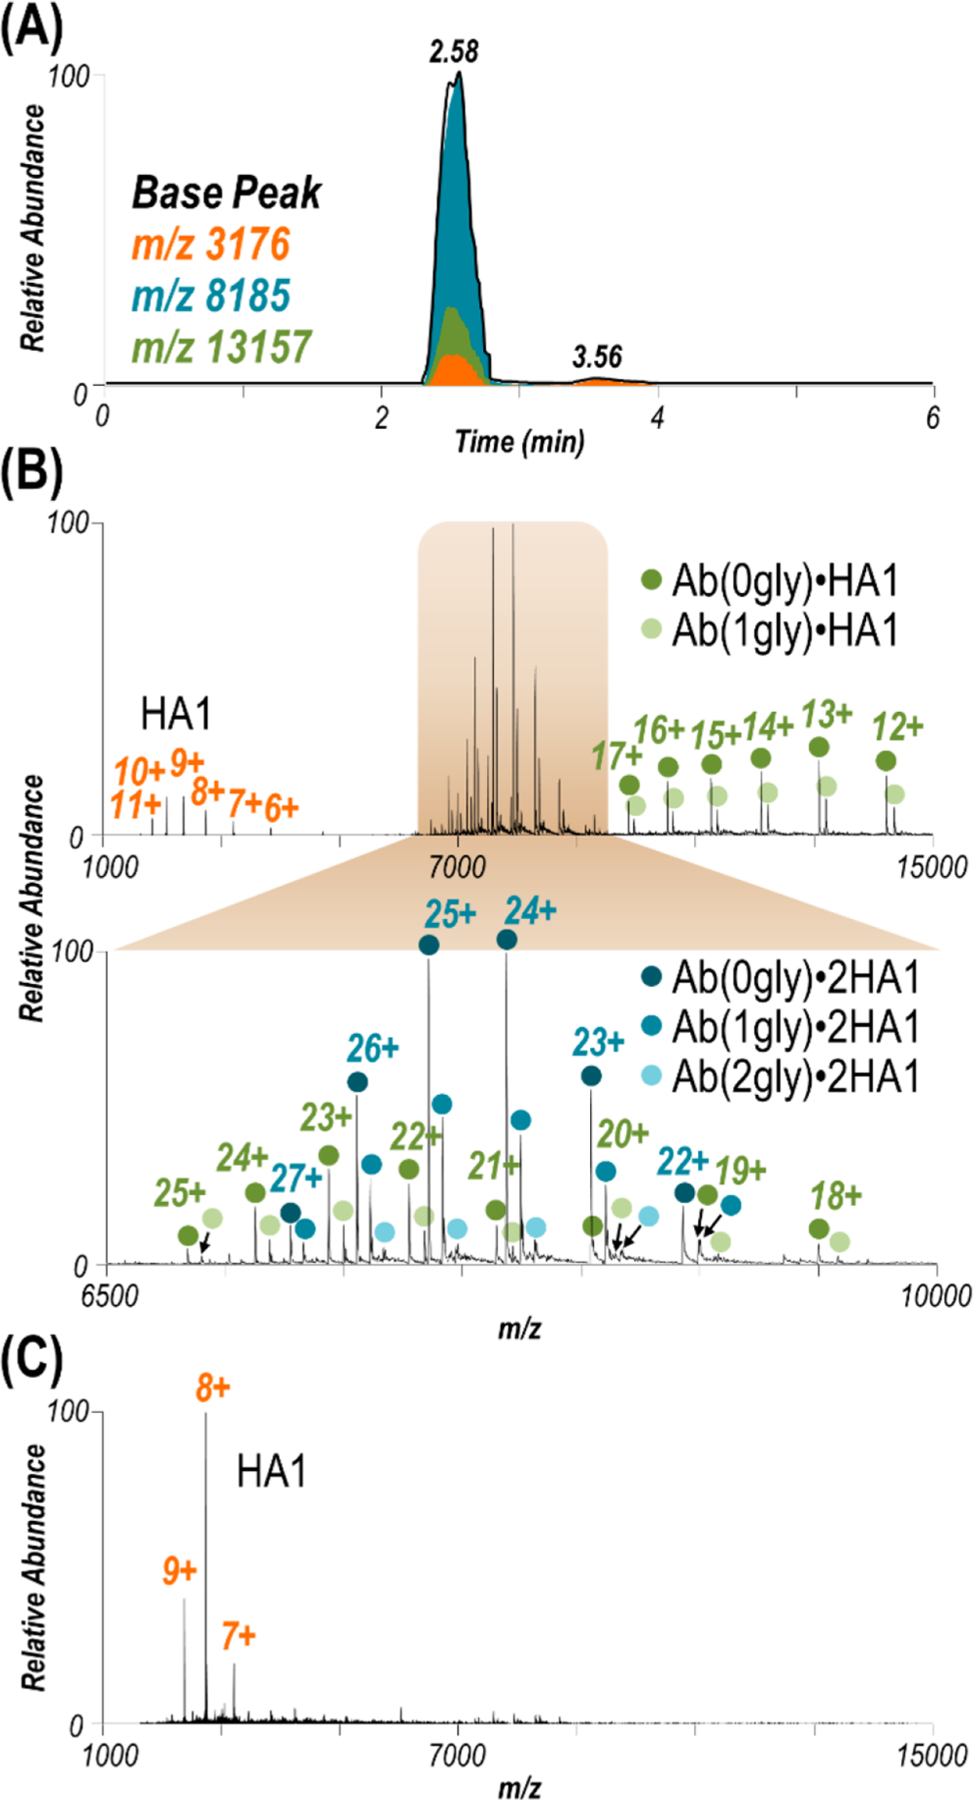
Figure 2.

(A) SEC LC trace for HA1 with the antibody at a 1:2 antibody:antigen ratio. Extracted ion chromatograms of the m/z values corresponding to HA1 (orange), Ab·HA1 (green), and Ab·2HA1 (turquoise). (B) ESI mass spectrum collected at retention time 2.58 min along with an expanded view of the range spanning m/z 6500–10000. Observed species include HA1, Ab·HA1, and Ab·2HA1 with 0–2 glycans (gly) attached to the antibody (glycoforms are denoted with colored circles for the complex). In-source trapping (−150 V) necessary to desolvate the Ab·2HA1 complex causes ejection of one HA1, resulting in the observed Ab·HA1 species and unbound HA1. Mass spectra of the complexes obtained using various in-source trapping energies are shown in Figure S6. (C) ESI mass spectrum collected at retention time 3.56 min suggesting a low abundance of unbound HA1 is in solution.
