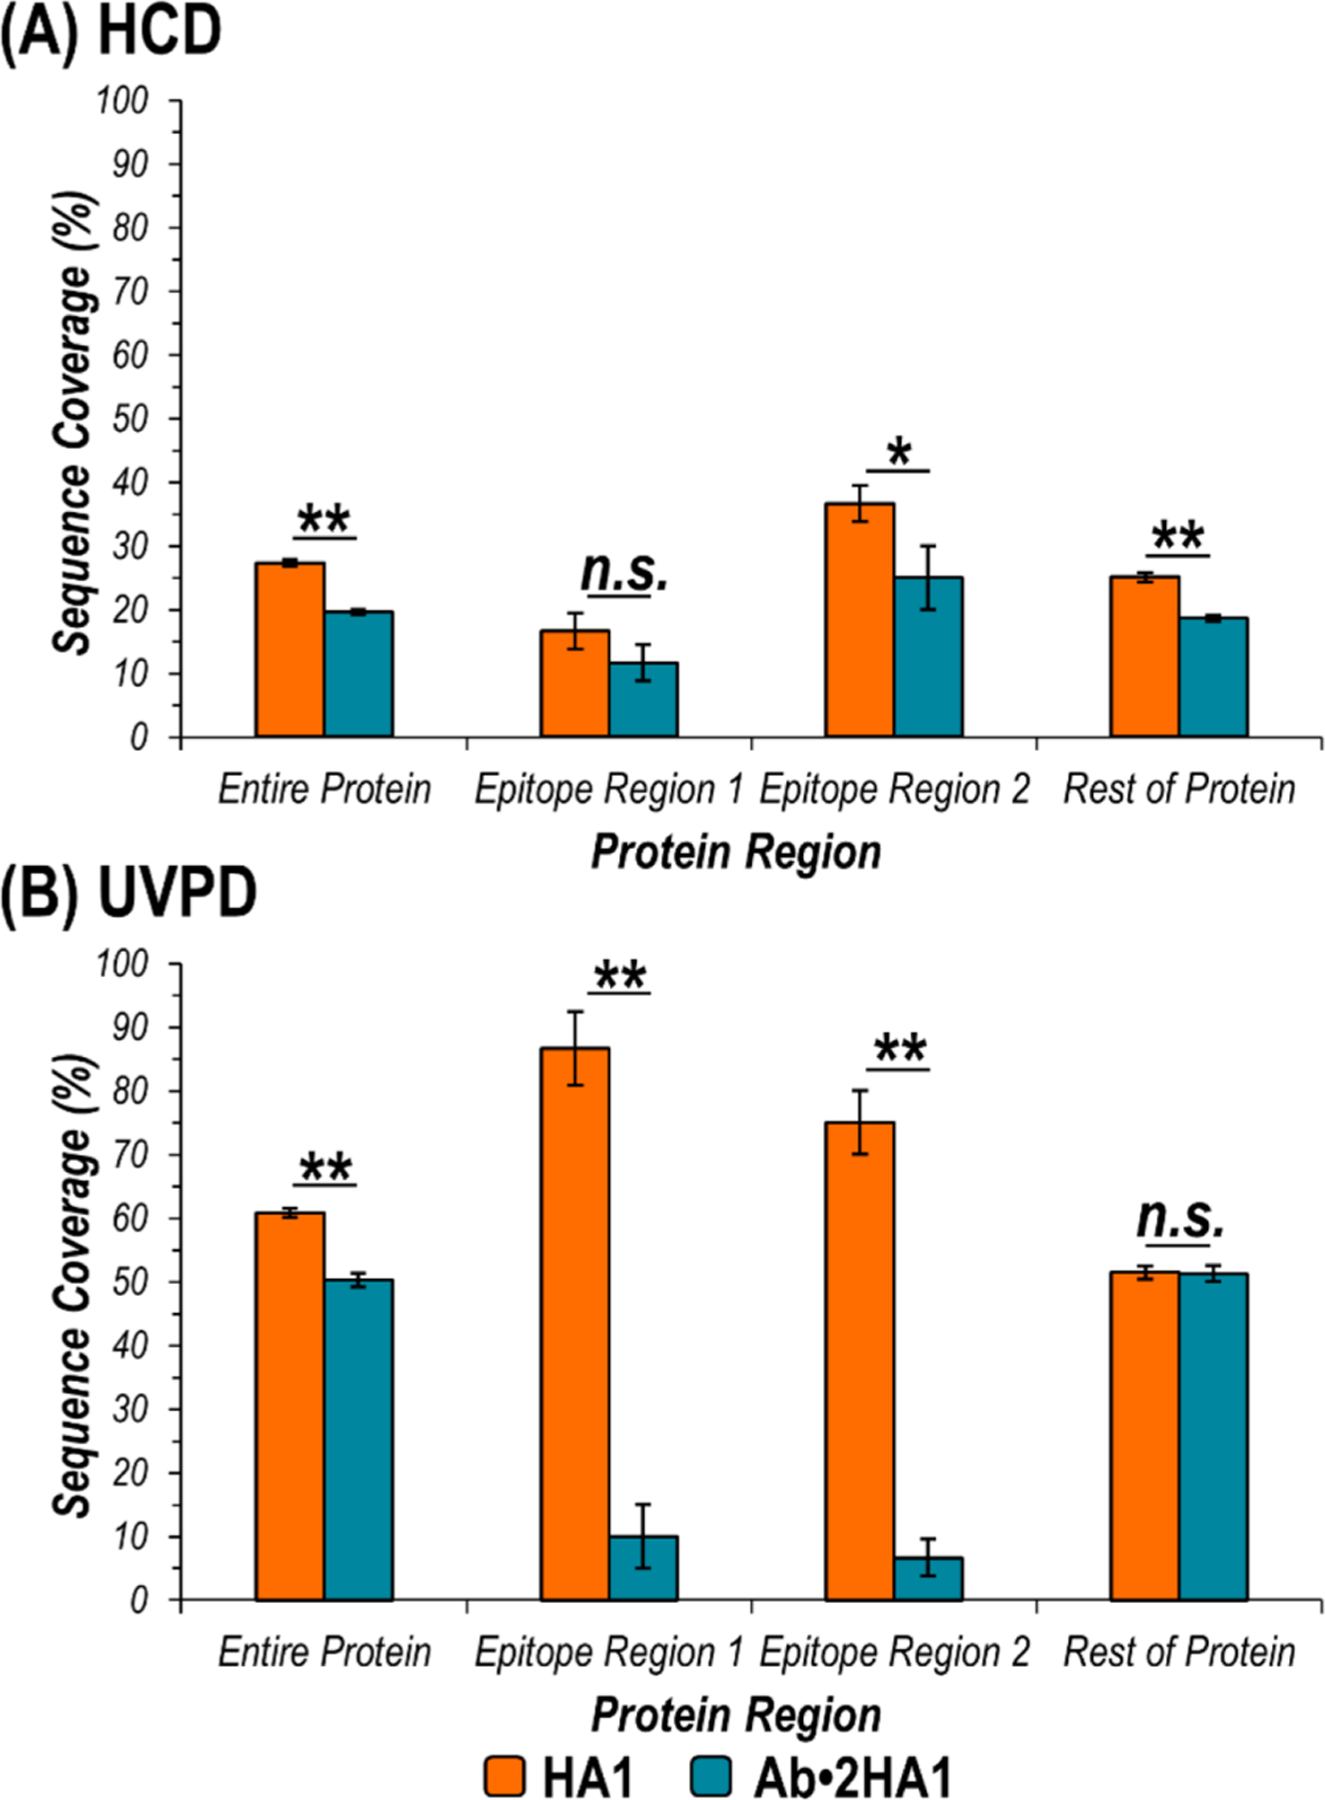
Figure 3.

Graphs displaying sequence coverage of various regions of HA1 afforded by activation of HA1 (10+) (orange) or the Ab·2HA1 (29+) complex (turquoise) using (A) HCD and (B) UVPD. In the expressed HA1 sequence, epitope region 1 encompasses residues T35-R55, while epitope region 2 includes amino acids F163-Y183 (corresponding to residues 90–109 and 213–233 in the HA protomer). The rest of the protein is defined as the entire expressed HA1 protein sequence excluding the two epitope regions. Asterisks indicate statically significant differences in sequence coverage for the two precursors at a 95% or 99% confidence level (*p-value < 0.05, **p-value < 0.01, n.s. = not significant).
