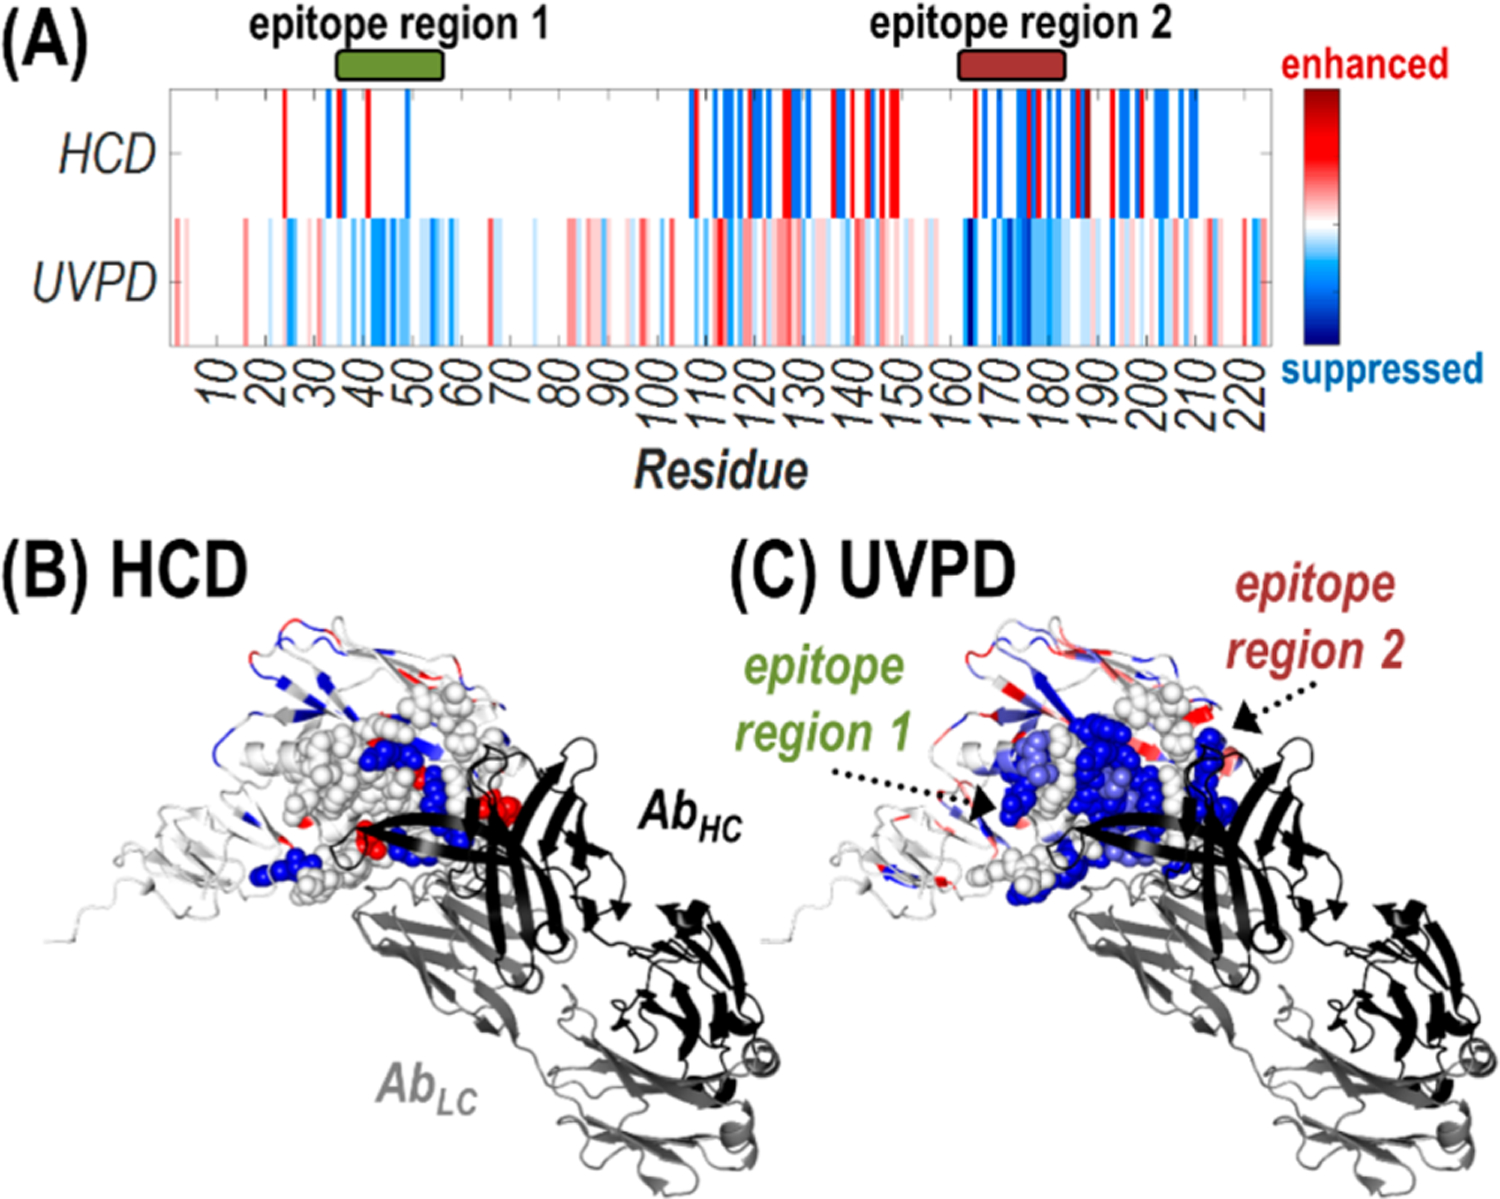
Figure 5.

Heat maps of the suppression (blue) or enhancement (red) in the number of observed sequence ions generated upon backbone cleavages bracketing each residue for activation of the Ab·2HA1 complex (29+) compared to the antigen alone (10+) using HCD and UVPD shown (A) for the HA1 sequence or (B, C) along the crystal structure of the HA1 domain of an HA protomer (H3N2 A/Texas/50/2012) bound to the antigen binding fragment (Fab) region of the S5 V2–29 IgG monoclonal antibody (PDB ID: 6E4X). Residues encompassing the two epitope regions are shown as spheres, while the light chain (gray) and heavy chain (black) of the antibody are labeled in (B).
