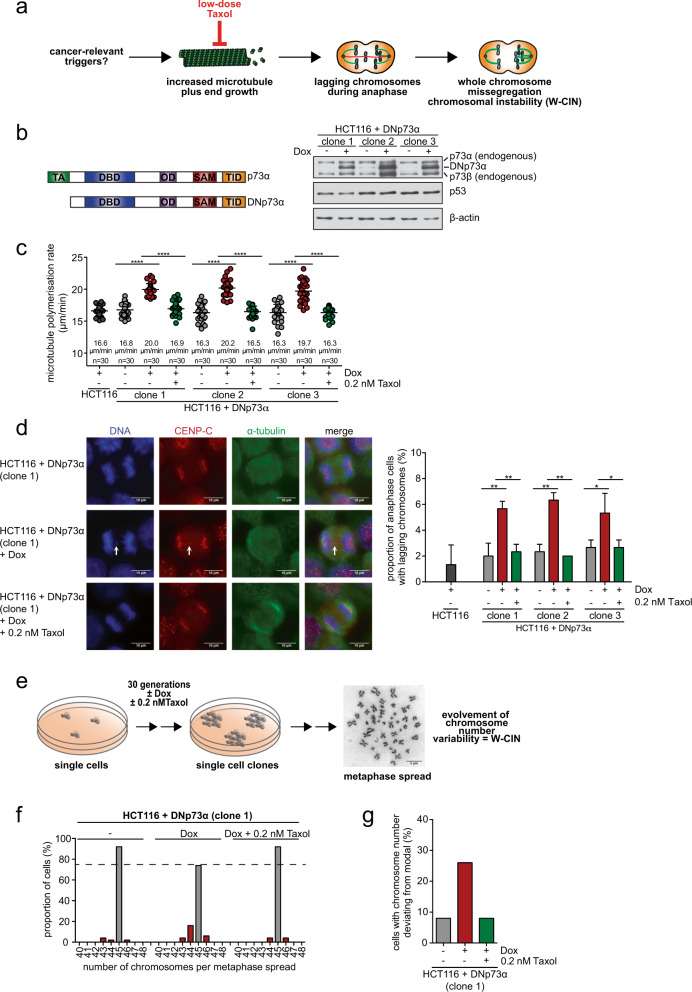
Fig. 1. Expression of oncogenic DNp73 induces whole chromosome instability by increasing mitotic microtubule plus end assembly rates.
a Model depicting the causal relationship between increased microtubule plus end growth rates in mitosis and the induction of chromosome missegregation constituting W-CIN. b Left panel: Model for the structure of p73 and DNp73: transactivation domain (TA), DNA-binding domain (DBD), oligomerization domain (OD), SAM domain (SAM), transactivation inhibitory domain (TID). Right panel: Doxycycline-inducible expression of DNp73 in chromosomally stable HCT116 cells. Three independent stable cell lines were treated with doxycycline for 24 h and expression of DNp73 was detected by western blotting. A representative western blot is shown. Note that the two bands for endogenous p73 represent the α and β isoforms of the protein. c Mitotic microtubule plus end assembly rates upon expression of DNp73. HCT116-DNp73 cell lines were treated with or without doxycycline and additionally with low-dose Taxol. As a control HCT116 parental cells were treated with doxycycline. Microtubule growth rates were determined by tracking EB3-GFP comets in mitotic cells by live-cell microscopy. Scatter dot plots show average microtubule polymerization rates (20 microtubules/cell, n = 30 mitotic cells from 3 independent experiments, mean ± SD, t-test). d Proportion of cells exhibiting lagging chromosomes in anaphase after expression of DNp73 and after restoration of proper microtubule growth rates. HCT116 parental cells were incubated with doxycycline as a control. Left: Representative examples of anaphase cells with or without lagging chromosomes (white arrows), Scale bar, 10 µm. Right: The graph shows the proportion of anaphase cells exhibiting lagging chromosomes for three independent stable cell lines (n = 300 anaphase cells from three independent experiments, mean ± SD, t-test). e Scheme depicting the generation of single-cell clones in order to determine chromosome number variability as a measure of W-CIN. f Proportion of cells harboring the indicated chromosome numbers per cell (n = 50 metaphase spreads). g Proportion of cells with chromosome numbers deviating from the modal (45 chromosomes in HCT116 cells). The calculation is based on analyses of chromosome number variability shown in f.

