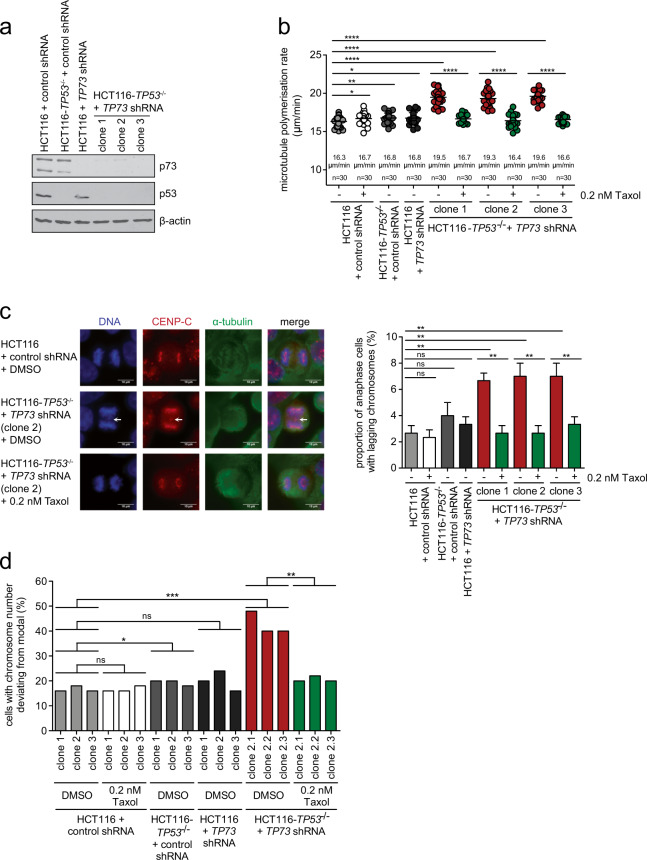
Fig. 2. Concomitant loss of p53 and p73 induces chromosomal instability by increasing mitotic microtubule plus end assembly rates.
a Generation of stable cell lines with loss of p53, p73 or concomitant loss of both. A representative western blot detecting p53 and p73 protein levels is shown. b Mitotic microtubule plus end assembly rates upon loss of p53, p73 or both. The indicated stable cell lines were used to measure microtubule plus end growth rates in mitosis by tracking EB3-GFP comets by live-cell microscopy. To restore normal microtubule growth rates, cells were treated with 0.2 nM Taxol for 16 h before measurement. Scatter dot plots show average microtubule polymerization rates (20 microtubules/cell, n = 30 mitotic cells from three independent experiments, mean ± SD, t-test). c Proportion of cells exhibiting lagging chromosomes in anaphase after loss of p53, p73 or both, and after restoration of proper microtubule growth rates. Left panel: Representative examples of anaphase cells with or without lagging chromosomes (white arrows), Scale bar, 10 µm. Right panel: The graph shows the proportion of anaphase cells exhibiting lagging chromosomes (n = 300 anaphase cells from 3 independent experiments, mean ± SD, t-test). d Induction of aneuploidy upon loss of p53/p73 and rescue upon restoration of proper microtubule growth rates. Single-cell clones derived from the indicated cell lines were grown in the presence or absence of 0.2 nM Taxol for 30 generations, chromosome numbers per cell were determined. The graph depicts the proportion of cells harboring chromosome numbers deviating from the modal (45 chromosomes in HCT116 cells, n = 50 cells).

