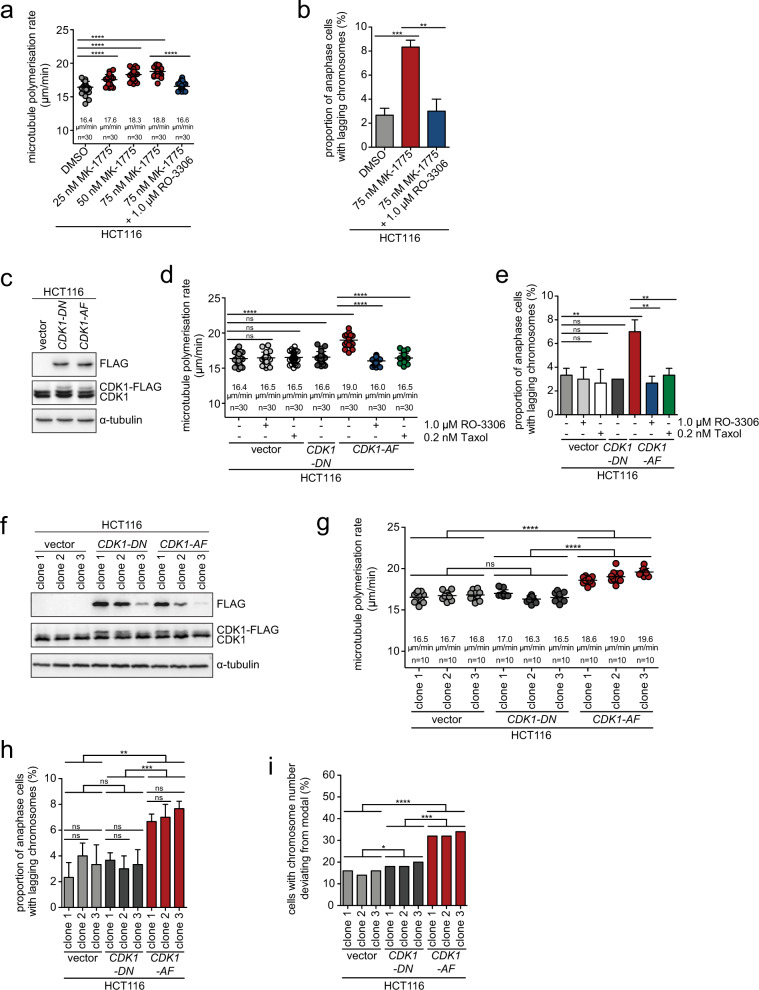
Fig. 5. Increased CDK1 induces chromosomal instability.
a Mitotic microtubule polymerization rates upon induction of CDK1 activity mediated by inhibition of wee1. HCT116 cells were treated with increasing concentrations of the wee1 inhibitor MK-1775 in the absence or presence of the CDK1 inhibitor RO-3306 and mitotic microtubule plus end assembly rates were determined. Average microtubule polymerization rates are depicted in scatter dot plots (20 microtubules/cell, n = 30 mitotic cells from three independent experiments, mean ± SD, t-test). b Induction of lagging chromosomes upon CDK1 activation mediated by wee1 inhibition. HCT116 cells were treated with MK-1775 in the absence or presence of RO-3306. The graph shows the proportion of anaphase cells exhibiting lagging chromosomes (n = 300 anaphase cells from three independent experiments, mean ± SD, t-test). c Transient expression of FLAG-tagged CDK1-AF (constitutive active) or CDK1-DN (inactive) in chromosomally stable HCT116 cells. A representative western blot detecting CDK1 protein levels and exogenously expressed CDK1 (FLAG) is shown. d Mitotic microtubule polymerization rates after transient expression of CDK1-AF or CDK1-DN in HCT116 cells. Average microtubule polymerization rates are depicted in scatter dot plots (20 microtubules/cell, n = 30 mitotic cells from three independent experiments, mean ± SD, t-test). e Quantification of cells exhibiting lagging chromosomes after transient expression of CDK1-AF or CDK1-DN in the absence or presence of RO-3306 or Taxol (n = 300 anaphase cells from three independent experiments, mean ± SD, t-test). f Generation of HCT116 cell lines stably expressing CDK1-AF or CDK1-DN. The expression level of the CDK1 variants was detected in three independent cell clones. A representative western blot is shown. g Mitotic microtubule polymerization rates in single-cell clones of HCT116 cells stably expressing CDK1-AF or CDK1-DN. Average microtubule polymerization rates are depicted in scatter dot plots (20 microtubules/cell, n = 10 mitotic cells for each independent single-cell clone, mean ± SD, t-test). h Quantification of cells exhibiting lagging chromosomes in HCT116 single-cell clones stably expressing CDK1-AF or CDK1-DN (n = 300 anaphase cells for each independent single-cell clone, mean ± SD, t-test). i Chromosome number variability in single-cell clones derived from HCT116 cells stably expressing CDK1-AF or CDK1-DN. The proportion of cells with a chromosome number deviating from modal (45 chromosomes for HCT116 cells) was calculated for three independent clones (n = 50 cells per single-cell clone).

