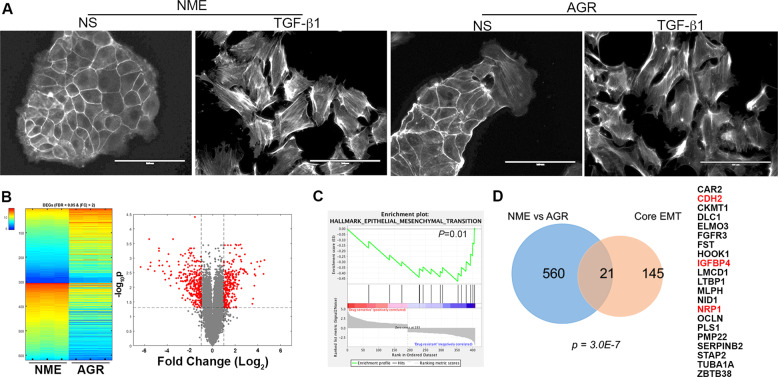
Fig. 2. Drug-resistant cells isolated from 3D culture have undergone EMT.
a Phalloidin staining to visualize the actin cytoskeleton in the NME and AGR cell lines under non-stimulated (NS) conditions and after 72 h of TGF-β1 (5 ng/ml) stimulation. b Heatmap and volcano plot visualizing differentially expressed genes (DEGs) between the drug-sensitive (NME) and AG1478-resistant (AGR) cell lines. The triplicate microarray analyses resulting in upregulated (top) and downregulated (bottom) genes with a fold change (FC) of >2 and a false discovery rate (FDR) of <0.05 are shown on the heatmap. These DEGs are also shown in red on the volcano plot. c Gene set enrichment analysis comparing the DEGs identified in the AGR cells to the hallmark-EMT gene set. This comparison resulted in the indicated P value. d Venn diagram indicating the number of genes similarly regulated in AGR vs. NME DEG set as compared to the core-EMT gene signature. The significance of overlap was calculated using a hypergeometric model resulting in the indicated P value. The 21 shared genes are listed on the right. The genes also regulated in the LAPR gene set described in Fig. 1 are indicated in red.

