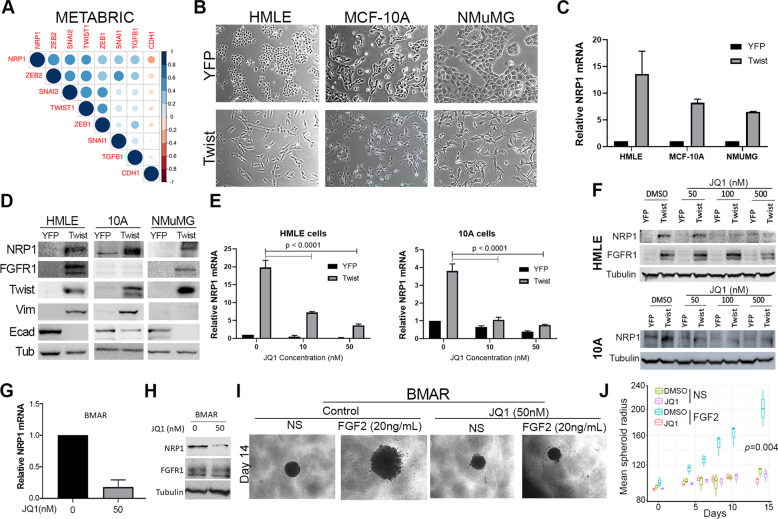
Fig. 6. Inhibition of BRD4 decreases NRP1 expression.
a Correlation between EMT transcription factors and NRP1 gene expression in the METABRIC dataset. b Phase-contrast microscopy showing the epithelial and mesenchymal phenotypes of control (YFP) and Twist-overexpressing HMLE, MCF-10A, and NMuMG cells. c RT-PCR showing NRP1 upregulation following Twist overexpression. Data are normalized to NRP1 levels in the control (YFP) cells for each cell type and are the mean ± SE of duplicate experiments completed in triplicate. d Immunoblot analyses showing expression of NRP1 and other EMT proteins in response to Twist overexpression. e RT-PCR showing NRP1 in control (YFP) and Twist-overexpressing cells following 7 days of treatment with the indicated concentrations of JQ1. Data are the mean ± SE of triplicate experiments resulting in the indicated P values. f Immunoblot analyses of NRP1 expression in control (YFP) and Twist-overexpressing HMLE and MCF-10A cells following 7 days of treatment with the indicated concentrations of JQ1. g RT-PCR analyses of NRP1 expression in afatinib-resistant (BMAR) cells following 7 days of treatment with JQ1 (50 nM). Data are the mean ± SE of triplicate experiments. h Immunoblot analyses of FGFR1 and NRP1 expression in BMAR cells following 7 days of treatment with JQ1 (50 nM). Expression of tubulin served as a loading control. i Phase-contrast images showing 3D spheroid growth of BMAR cells in response to FGF2 (20 ng/ml) in the presence or absence of JQ1 (50 nM). j Measurement of BMAR spheroid radius at the indicated time points, under the conditions described in i. Data are represented as a boxplot including the measurement of at least three images per condition and are representative of two independent experiments.

