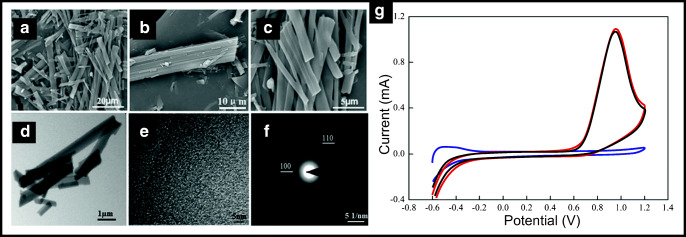
Fig. 5.
SEM and TEM micrographs of the h-BN whiskers. a Low-magnification SEM images; b, c high-magnification SEM images. d TEM images. e HRTEM. f The SAED pattern. Cyclic voltammetric curves (g) of the poorly crystallised BN whiskers electrode (red line), the highly crystallised BN whiskers electrode (black line) and bare Ti electrode (blue) towards the electrochemical oxidation of nitrite (1.0 m mol L−1 nitrite in 0.1 mol L−1 phosphate buffer). Reproduced from reference [61] with permission of the Royal Society of Chemistry

