
Fig. 2.
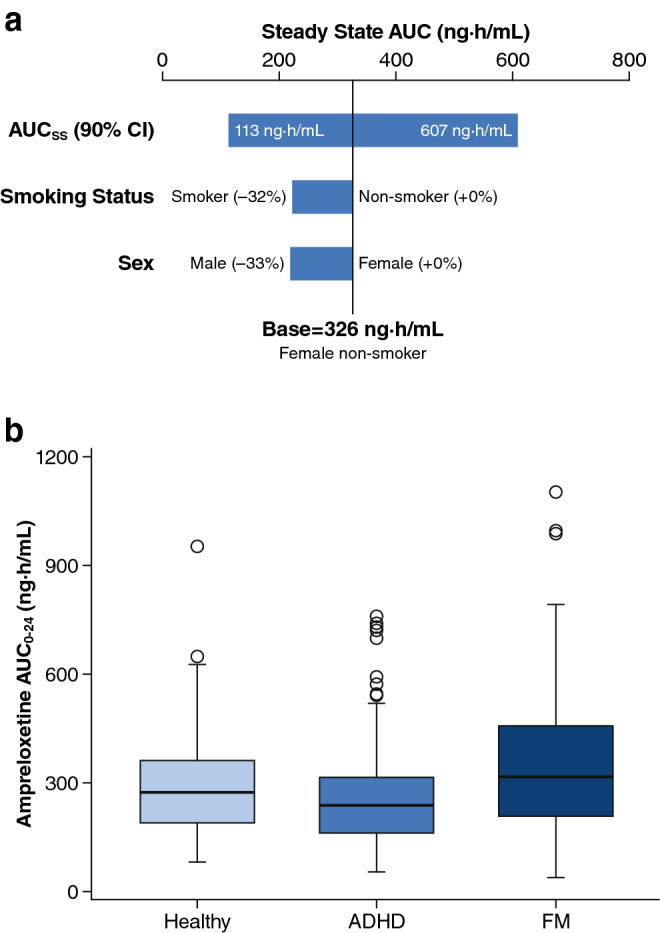
Effect of covariates on the model-predicted ampreloxetine exposure following repeated 10-mg once-daily dosing: a sensitivity plot comparing the effect of significant covariates, b grouped by disease state. Base, as represented by the black vertical line, refers to the predicted typical area under the concentration–time curve from time 0 to 24 h (AUC0–24) in a female non-smoker from the population pharmacokinetic model. The top horizontal bar with values at each end shows the 5th to 95th percentile AUC0–24 range across the entire population. The middle and lower horizontal bars represent the influence of a single categorical covariate on AUC0–24, with one subject created from each category with other covariates fixed at the typical values for the base subject. The solid black line denotes the median; the top and the bottom of the box denote the first and third quartiles; the whiskers denote 1.5 times the interquartile range. ADHD attention-deficit/hyperactivity disorder, AUCss AUC at steady state, CI confidence interval, FM fibromyalgia