Fig. 3.
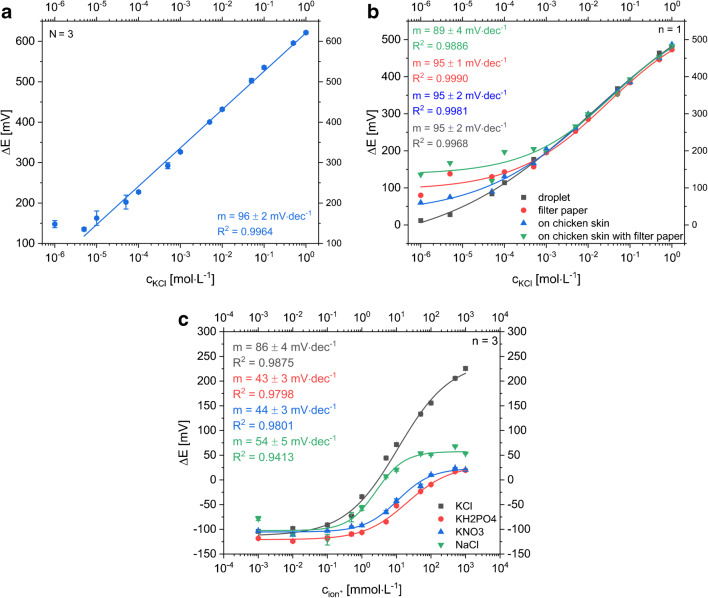
a Dose-response curve of a potentiometric, planar LIG-based sensor with Ag/AgCl RE measuring KCl concentrations ranging from 10−6 to 1 mol L−1 with the droplet method (Nsensor = 3). The linear range goes down to 1·10−5 mol L−1 KCl and the slope is 96 ± 2 mV·dec−1. The small standard deviation, represented as error bars, especially in the linear range, indicates a reproducible electrode fabrication procedure. b Dose-response curves of the potentiometric LIG sensor with Ag/AgCl RE. KCl samples were measured by application of droplets (gray boxes), using a filter paper as sweat collection pad (red circles), measuring sample droplets on chicken skin (blue triangle) and on chicken skin with filter paper (green triangle). c Dose-response curves of one sensor when different electrolytes containing K+ and Cl− ions are measured to demonstrate the sensor’s sensitivity towards both species (gray boxes: KCl, red circles KH2PO4, blue triangles: KNO3 green triangles: NaCl)

