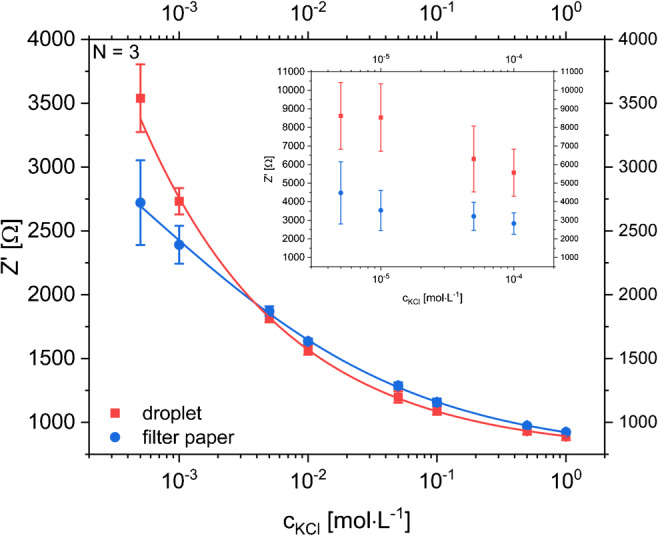
Fig. 5.

Dose-response curve of impedance measurements of KCl solutions with concentrations ranging between 5·10−4 and 1 mol L−1 in a planar all-LIG setup (Nsensor = 3) with the droplet method (blue circles) and Whatman® 595 filter paper (red boxes) to simulate a sweat collection pad. The inset shows a zoomed-in section for the concentration range below the relevant range. Instrumental settings: fixed frequency of 1000 Hz with an AC amplitude of 10 mV and DC potential of 0 V
