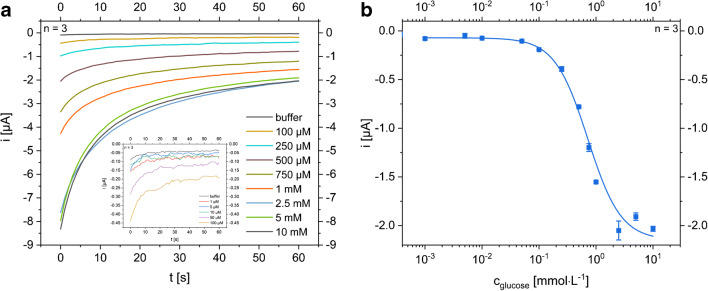
Fig. 6.
a Exemplary time versus current curves of chronoamperometric characterization of a modified glucose biosensor with chemical deposited Prussian blue layer, 0.1% chitosan membrane, and theoretical GOx activity of 1 U mm−2(n = 3, error bars are hidden for clarity). The applied potential was − 50 mV vs. LIG. Run time was 60 s and the sample was applied as a droplet. The magnified cutout demonstrates that low glucose solutions can be distinguished from each other. b Dose-response curve (n = 3, SD represented by error bars, droplet method) resulting from the respective I vs. t curve after a run time of 60 s on half-logarithmic scale. LOD is 13.7 ± 0.5 μmol L−1 and LOQ is 42 ± 2 μmol L−1

