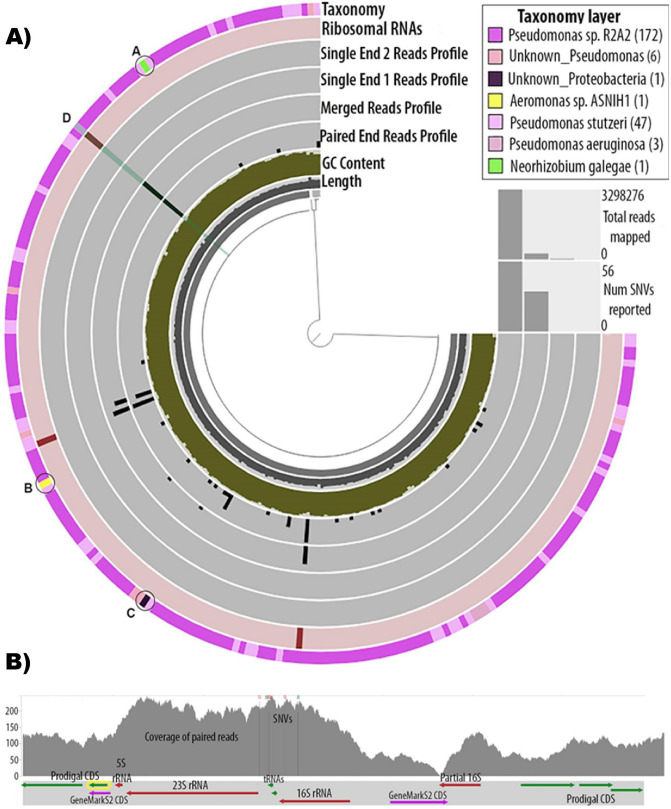
Figure 3.
Genome analysis of a representative strain. The same analysis was applied for all strains. (A) Anvi’o representation of the genome assembly of Strain03. The tree structure in the inner circle represents the scaffolds of the genome. The black first inner layer is the length of the split for which all above layers are calculated, the dark-greened second layer is the GC content, the third, fourth, fifth and sixth layers represent the variability (SNVs) (in black) found in the paired end reads, merged reads, single end from pair 1 reads and single end from pair 2 reads, respectively. The seventh layer represents the rRNAs found in the genome, and the last outer layer represents the gene-level taxonomy. Coloration of the outer layer is according to taxonomy assignment as indicated in the upper right insert. Anvi’o splits that were not taxonomically assigned under the Pseudomonaceae family are marked as A, B and C. The highlighted split D, is explored further in Fig. 5. (B) Detailed view of a part of the genome of Strain03. In the upper frame the coverage of the paired end reads is depicted in the gray graph. Vertical lines with colored nucleotide letters on top depict position of the SNVs. The lower frame shows the genes found in the particular split, their length and orientation. An rRNA operon (16S rRNA, 23S rRNA and 5S rRNA) is shown in this split. A partial 16S rRNA with only 55% of its sequence aligned to 16S rRNA is also shown to be found outside of the rRNA operon. Most CDS shown were predicted by Prodigal (green arrows), except for the two CDS predicted by GeneMarkS2 (purple arrows), as indicated in the figure. The annotation of the yellow framed CDS is given in Table 2.

