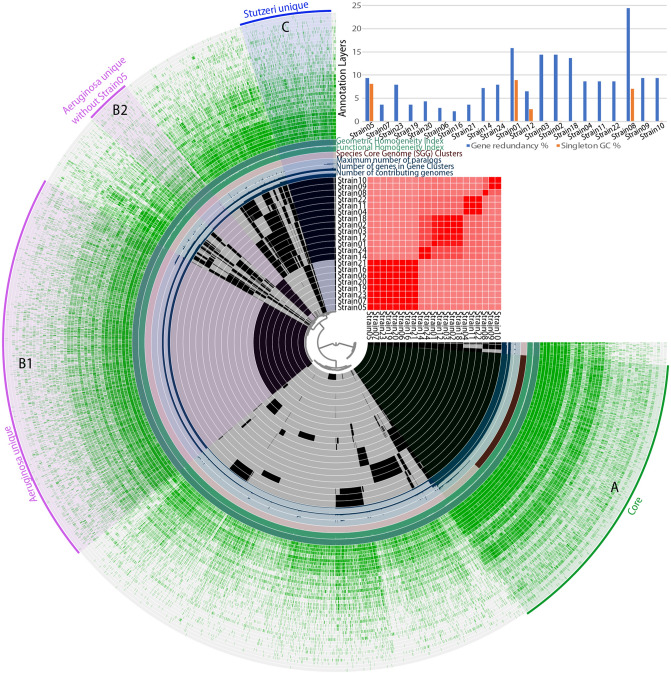
Figure 5.
Anvi’o representation of the pangenome of the 21 Pseudomonas genomes. The first 21 layers represent each genome, and the black coloration signifies the existence of a Gene Cluster (GC). To the right is given an ANI percentage identity heatmap of the same genomes. The subsequent 6 layers correspond to various statistics related to the analysis i.e. the number of contributing genomes per GC, number of genes per GC, maximum number of paralogs per GC, Species Core Genome Clusters, Functional Homogeneity Index and Geometric Homogeneity Index. The last 38 layers represent the various annotation sources for each GC and the green coloration signifies the existence of annotation. “A” represents the common GCs to all 21 strains (Core genome). “B1” represents the GCs unique to the Aeruginosa group strains and “C” represents the GCs which are unique to the Stutzeri group strains. “B2” represents the GCs specific to the Aeruginosa group strains but without Strain05 which has no GCs in this bin. The bar chart at the top right represents the gene redundancy (blue bar color) and the singleton GC (orange bar color) per genome.

