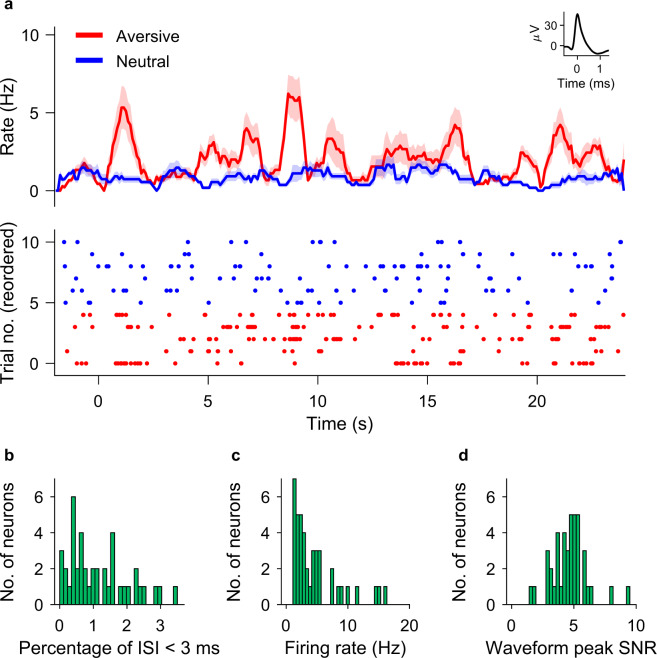
Fig. 2.
Neuronal firing and spike sorting quality metrics. (a) Example neuron in the amygdala. Top: Peristimulus time histogram (bin size: 100 ms; step size: 10 ms) for aversive (red) and neutral (blue) conditions. Shaded areas represent ± s.e.m. across trials of all spikes associated with the neuron Inset: mean extracellular waveform ± s.e.m. Bottom: Raster plot of trials reordered by trial condition for plotting purposes only. The trial onset is at time t = 0. (b) Histogram of percentage of inter-spike intervals (ISI) <3 ms. The majority of neurons had less than 0.5% of short ISI. (c) Histogram of average firing rate for all neurons. (d) Histogram of the signal-to-noise ratio (SNR) of the peak of the mean waveform.

