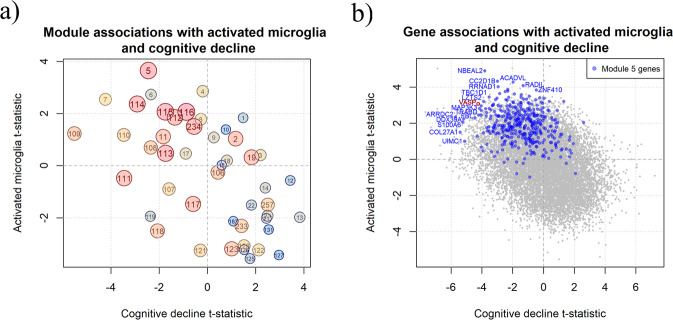
Fig. 3. Association of genes and modules with microglia morphology.
a Scatter plot displaying on the Y axis, the t-statistics for associations between module expression in our DLPFC bulk RNA-seq data and the proportion of activated (stage III) microglia and on the X axis t-statistics for module expression and cognitive decline. Each circle represents one module, and the number of the module is listed in each circle. m5 is the module most positively associated with the number of stage III microglia. To illustrate the extent of a module’s enrichment for the HuMiAged microglia signature genes, we have both colored the modules (red being more enriched, blue less enriched) and made the size of the circle proportional to the enrichment (the larger circles such as m116 are more enriched for microglial genes). The t-statistics are derived from linear models adjusted for age, sex, study (ROS or MAP), RNA integrity number (RIN), and postmortem interval. b Scatter plot displaying on the Y axis, the t-statistics for the association of a gene’s expression level and the proportion of activated (stage III) microglia and on the X axis t-statistics for the association of the gene’s expression level and cognitive decline. A subset of genes in module 5 which has extreme results are labeled. All genes belonging to module 5 are in blue with VASP highlighted in red. The t-statistics are derived from linear models adjusted for age, sex, study (ROS or MAP), RIN, and postmortem interval.

