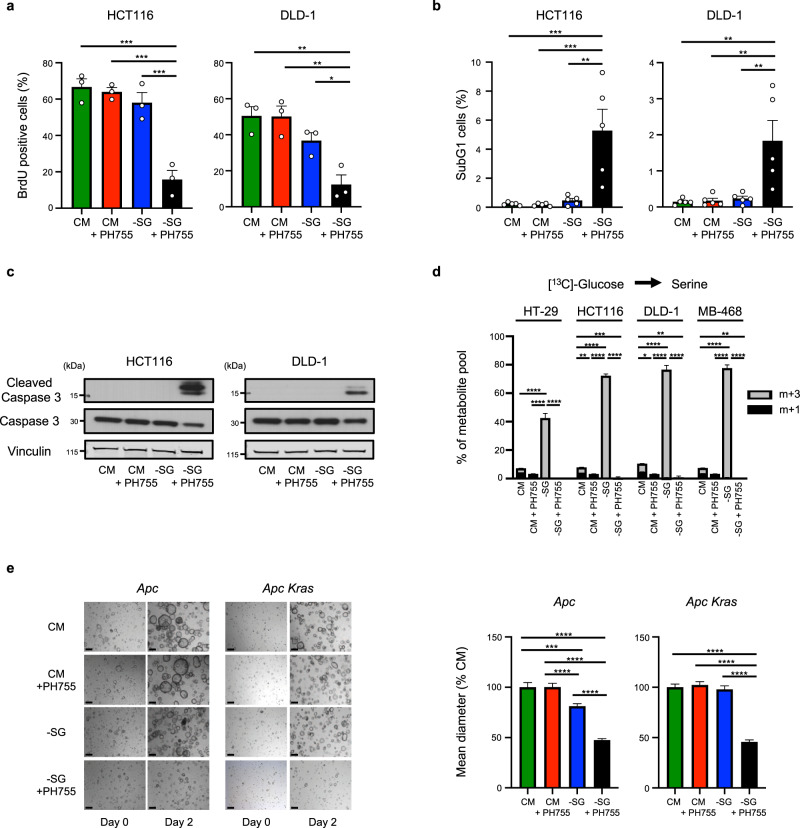
Fig. 2. PHGDH inhibition cooperates with serine/glycine depletion to limit DNA synthesis, survival and organoid growth.
a Percentage of BrdU positive cells in HCT116 and DLD-1 cells grown in CM or -SG medium ±10 µM PH755 for 48 h followed by a 5-h incubation with 10 µM BrdU. Data represents mean ± SEM of three independent experiments (*p < 0.05, **p < 0.01, ***p < 0.001, one-way ANOVA with Tukey’s post hoc test). b Percentage of SubG1 cells in HCT116 and DLD-1 cells grown in CM or -SG medium ±10 µM PH755 for 48 h. Data represents mean ± SEM of five independent experiments (**p < 0.01, ***p < 0.001, one-way ANOVA with Tukey’s post hoc test). c Cells were grown in CM or -SG medium supplemented or not with 10 µM PH755 for 2 days (HCT116) or 3 days (DLD-1). Western blots show the expression of cleaved Caspase-3 and Caspase-3. Membrane was reprobed with vinculin as a loading control. Data are representative of three independent experiments. d Intracellular serine level in cells grown in CM or -SG medium ±10 µM PH755 containing U-[13C]-glucose was measured by LC-MS. Metabolite percentages are represented as mean ± SEM of triplicate cultures and are representative of three independent experiments (*p < 0.05, **p < 0.01, ***p < 0.001, ****p < 0.0001; one-way ANOVA with Tukey’s post hoc test). e Intestinal tumour organoids derived from Vil1-creER;Apcfl/fl (Apc) and Vil1-creER;Apcfl/fl;KrasG12D/+ (Apc Kras) mice were grown in CM or -SG medium supplemented or not with 10 µM PH755. Left panel: representative pictures of the organoids are shown before (day 0) and 2 days after medium change. Right panel: quantification of organoid diameter 2 (Apc) or 4 days (Apc Kras) after medium change. Data are presented as mean ± SEM (n = number of organoids measured per condition; Apc: CM: n = 113, CM + PH755: n = 200, -SG: n = 190, -SG + PH755: n = 158; Apc Kras: CM: n = 149, CM + PH755: n = 134, -SG: n = 134, -SG + PH755: n = 78) and are representative of at least two independent experiments (***p < 0.001, ****p < 0.0001; one-way ANOVA with Tukey’s post hoc test). Scale bar represents 200 μm.

