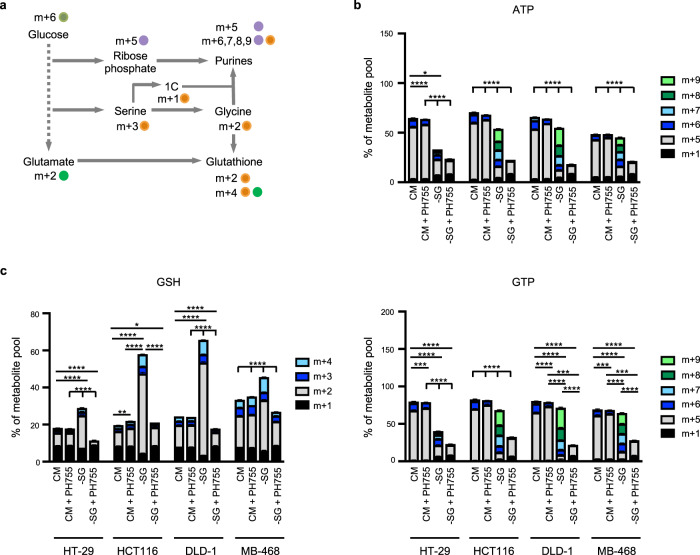
Fig. 3. Combining PHGDH inhibition with serine/glycine depletion inhibits purine and glutathione synthesis.
a Scheme representing the fate of uniformly carbon labelled glucose (m + 6) into purine and glutathione synthesis. Glucose is converted through the pentose phosphate pathway into ribose-5-phosphate, a five-carbon sugar (m + 5), that will be added to purine bases to form purine nucleosides. Purine rings also contain two one-carbon units and an intact glycine that can both come from serine metabolism. Serine is synthesised from the glycolytic intermediate 3-PG, producing an m + 3 isotopomer from uniformly labelled glucose. Serine (m + 3) can generate labelled glycine (m + 2) and labelled one-carbon units (m + 1). The combination of labelled ribose phosphate, glycine and one-carbon units can thus generate m + 5 and greater labelled purines. While m + 5 labelled purines represent a contribution of glucose to ribose synthesis alone, m + 6–9 labelled purines are likely to represent a contribution from de novo synthesised serine. Glutathione is made from glycine, glutamate (both can be m + 2 labelled from glucose) and cysteine. The main isotopomer (m + 2) of glutathione is likely to be derived from m + 2 glycine with the m + 4 labelling reflecting incorporation of m + 2 glycine and m + 2 glutamate. b, c Intracellular ATP and GTP levels (b) or GSH level (c) in HT-29, HCT116, DLD-1 and MDA-MB-468 cells grown in CM or -SG medium ±10 µM PH755 containing U-[13C]-glucose were measured by LC-MS. Metabolite percentages are represented as mean ± SEM of triplicate cultures and are representative of three independent experiments. Statistics have been performed by comparing the sum of m + 6–9% of metabolite pool for ATP and GTP and the sum of m + 2–4% of metabolite pool for GSH between experimental groups (*p < 0.05, **p < 0.01, ***p < 0.001, ****p < 0.0001; one-way ANOVA with Tukey’s post hoc test).

