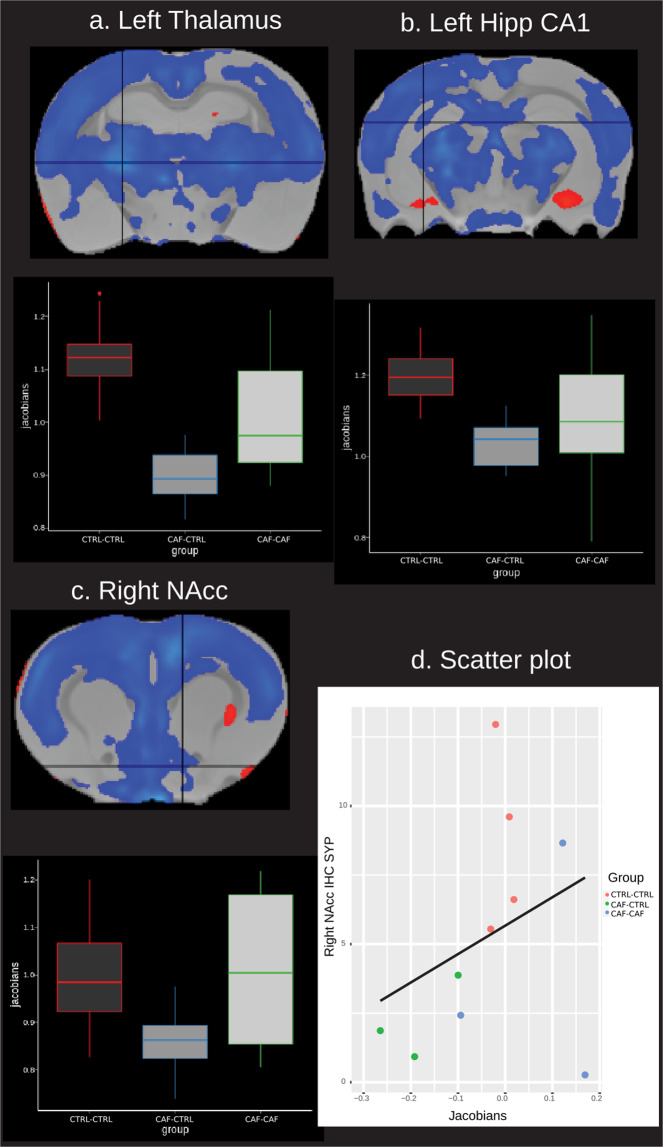
Fig. 2. DBM of brain volume in the offspring.
Boxplots show the relative volume (y axis = Jacobians) in each group (x axis) in several significant peaks. The peaks are shown in the crosshairs. a ROI = left thalamus, b left hippocampus CA1, c right NAc, d scatter plot between immunohistochemistry results in the right nucleus accumbens (y axis) and right nucleus accumbens peak volume (x axis). No significant correlation was found in d. Blue-light blue = lower volume; red-yellow = higher volume. Results are significant at FDR 5%.

