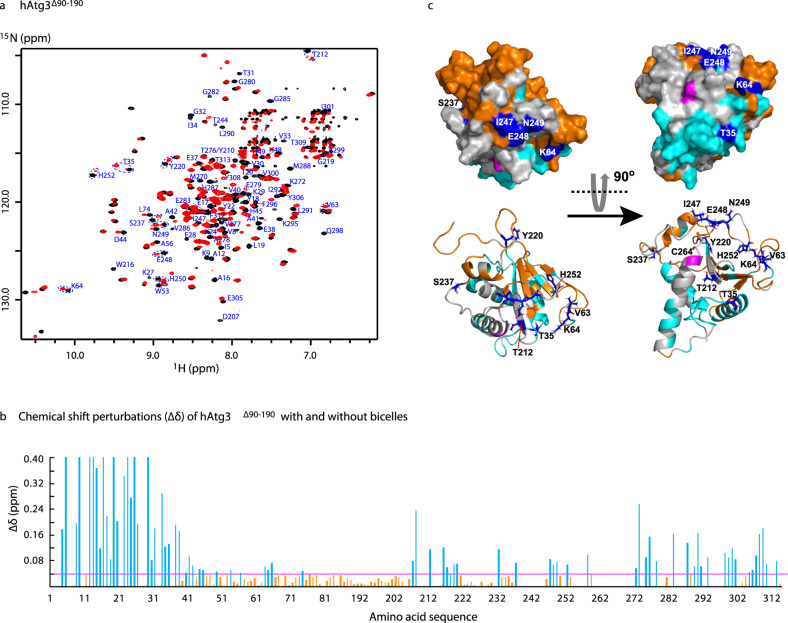
Fig. 5. Binding of hAtg3∆90-190 to bicelles results in structural arrangements beyond its NT.
a Overlay of 2H,15N,13C-labeled hAtg3∆90-190 TROSY spectra acquired on a Bruker 600 MHz spectrometer at 25 °C, pH 7.5 in the absence (black) and presence (red) of bicelles (DMPC:DMPG:DHPC = 4:1:20, molar ratio). b Plots of hAtg3∆90-190 15N and 1H chemical shift perturbations (CSPs, ∆δ) upon interaction with bicelles against residue numbers. , and represent the changes in 1H and 15N chemical shifts upon interacting with bicelles, respectively. c Surface and ribbon representations of a hAtg3 structural model with perturbed residues (∆δ ≥0.04 ppm) colored cyan and unperturbed residues (∆δ < 0.04 ppm) colored orange. The active site C264 is highlighted in magenta and unassigned residues are colored white. Some resonances displaying large CSPs are circled in (a) and their corresponding residues are colored blue in (c).

