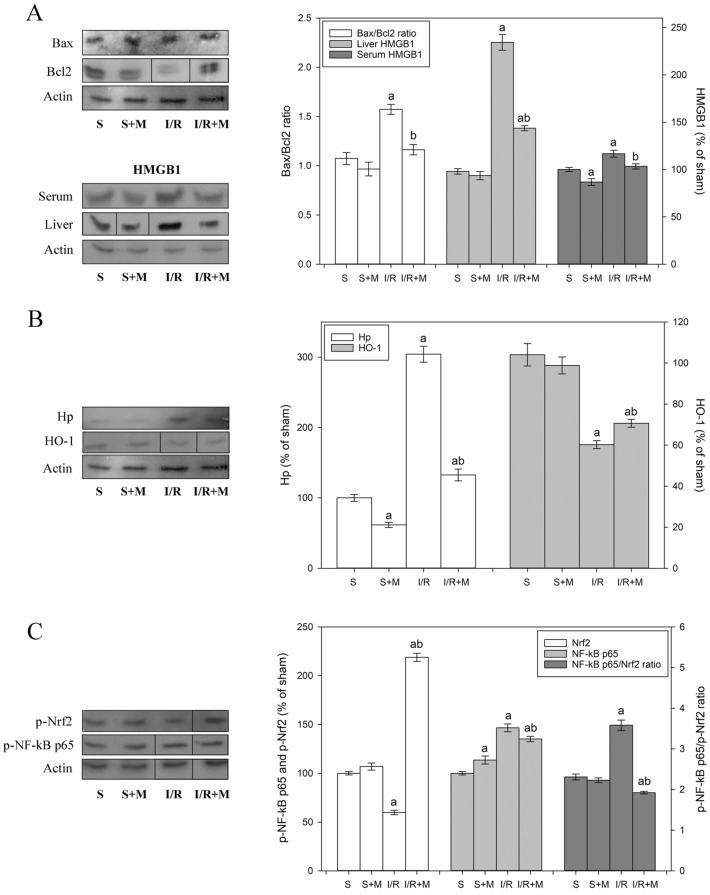
Figure 1.
Representative immunoblots of protein expression levels: (A) liver Bax/Bcl-2 ratio, and liver and serum HMGB1 expression; (B) liver Hp and HO-1 expression; and (C) liver p-Nrf2 and p-NF-κB p65 expression, and p-NF-κB p65/p-Nrf2 ratio. β actin was used as a loading control. The blots cropped from different gels are delineated with the black line (see Supplementary Information). Experimental group abbreviations: S sham-operated rat group, S + M sham-operated + meldonium rat group, I/R ischemia/reperfusion rat group, I/R + M ischemia/reperfusion + meldonium rat group. The number of animals per experimental group: n = 8. Data are given as mean ± standard error of the mean. Minimal significant level: p < 0.05. Significantly different: ain respect to S group; bin respect to I/R group.

