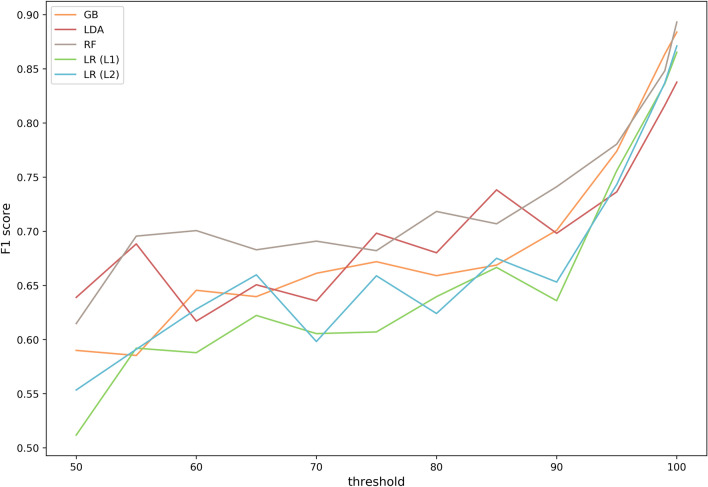
Figure 4.
Cross-validated F1 scores of the tested predictive models across different thresholds for sequence similarity. Grouped, nested fourfold cross-validation was performed to tune the hyperparameters in the inner loop (GB, RF and LR) and measure performance in the outer loop. This was repeated for different thresholds of sequence similarity in the dataset that controlled the grouping in the cross-validation (i.e. the lower the threshold, the more sequences were grouped into the same fold making test set predictions more difficult). As performance metric, the F1 score was computed for every model at every threshold.

