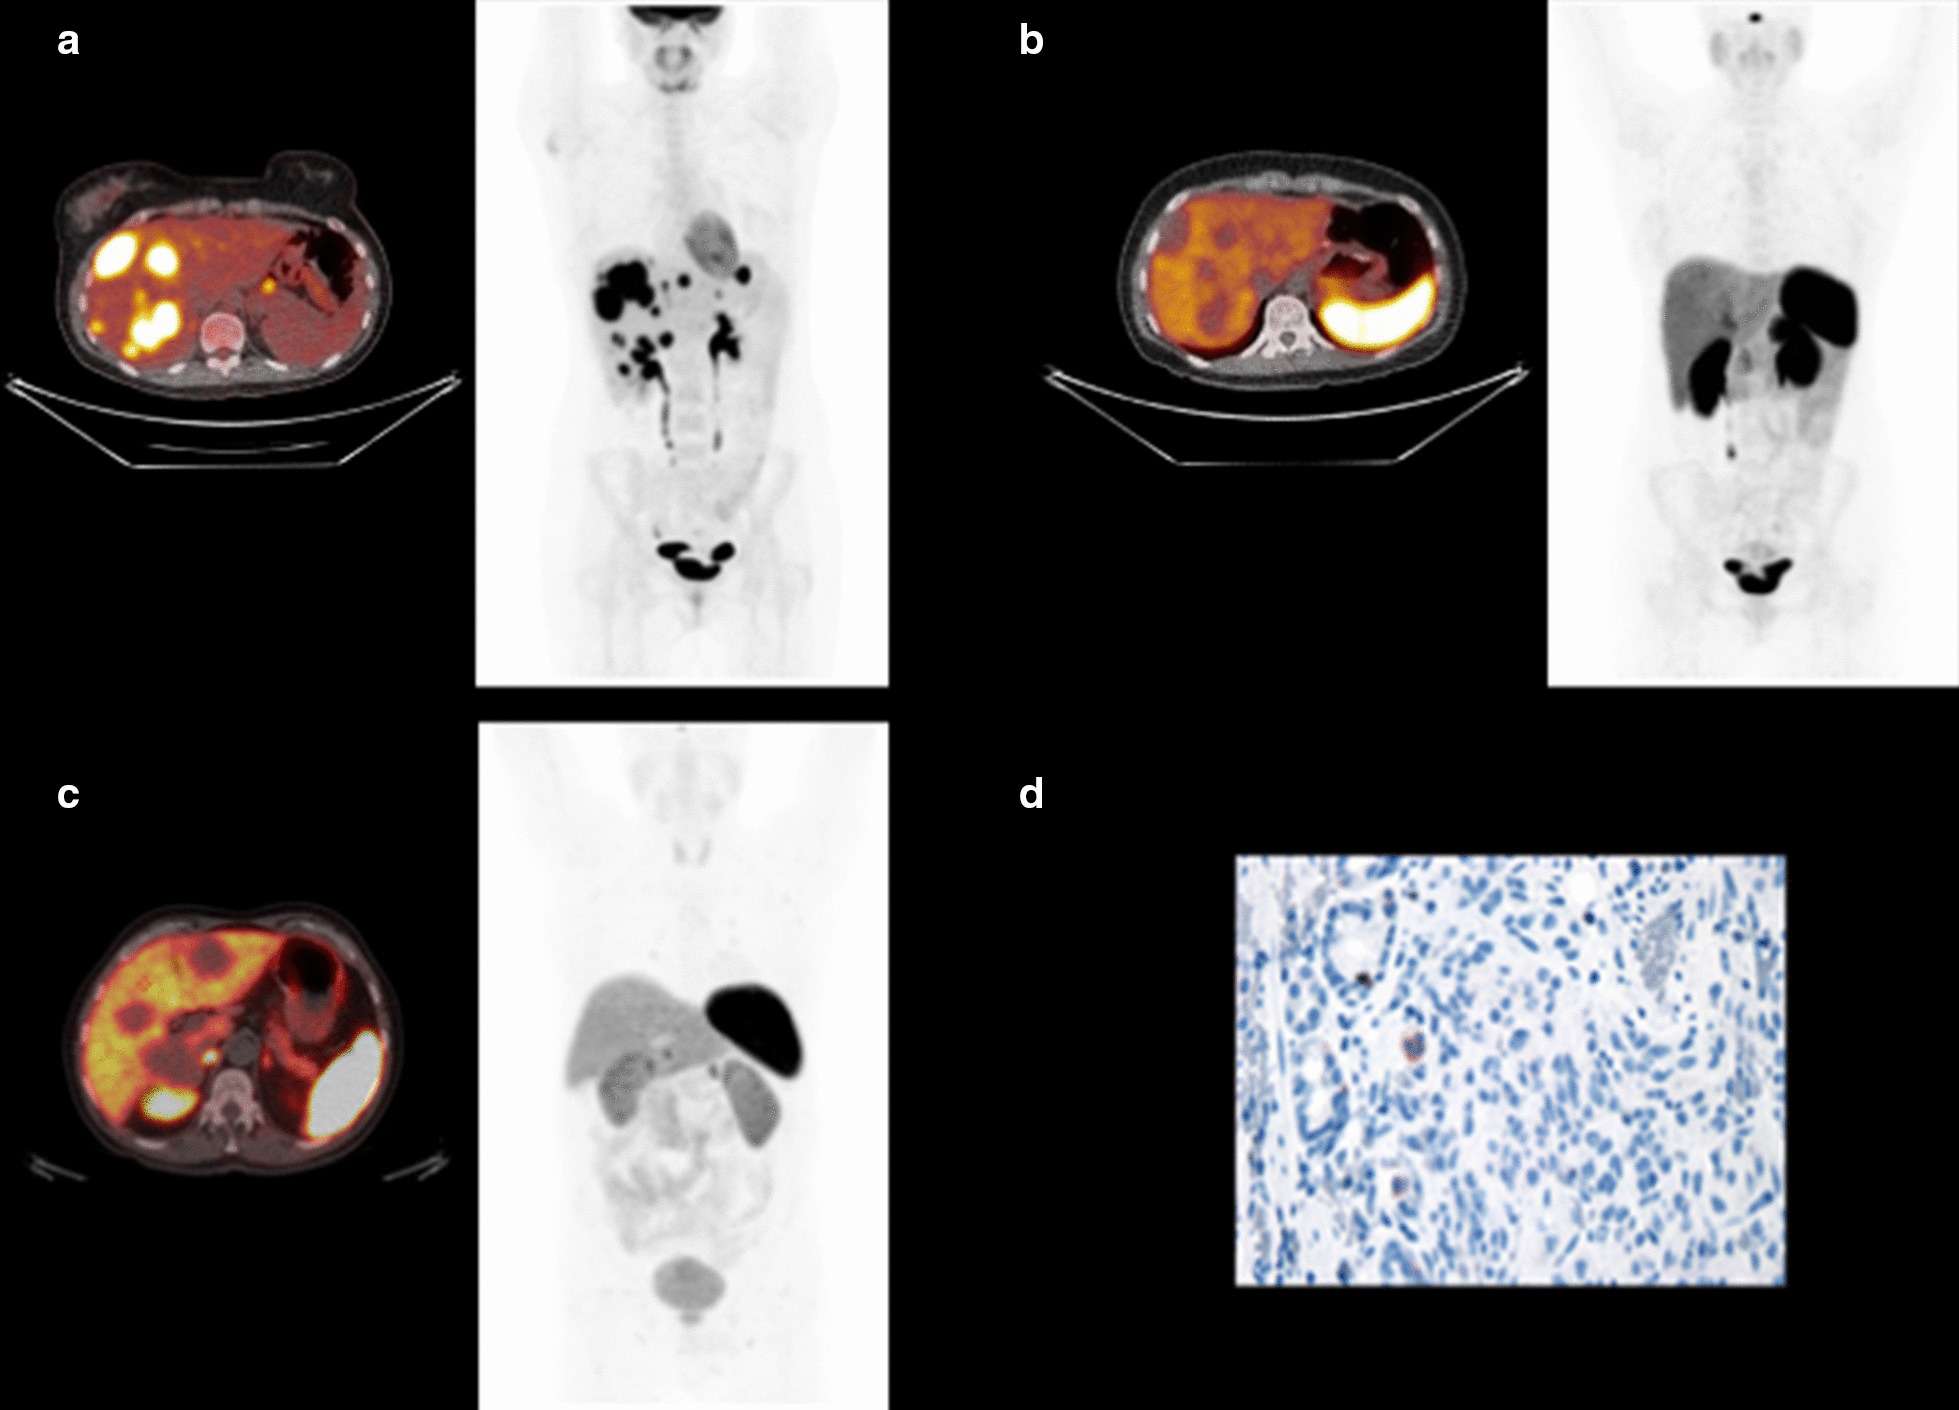
Fig. 2.

Panel A shows an axial fused [18F]FDG PET/CT image of the liver with a maximum intensity projection (MIP) image demonstrating highly FDG-avid liver and nodal metastases in case 001. Panel B shows the corresponding (case 001) trans-axial fused image of the [68 Ga]Ga-DOTATATE PET/CT and MIP image demonstrating low tracer uptake in the liver metastases (SUVmax 3) compared to background liver. Panel C, fused transaxial [68 Ga]Ga-DOTATATE PET/CT image and corresponding MIP image showing non-avid liver metastases in case 010 (SUVmax 2.5). Panel D shows negative SSTR2 expression of a liver metastasis on IHC for case 010
