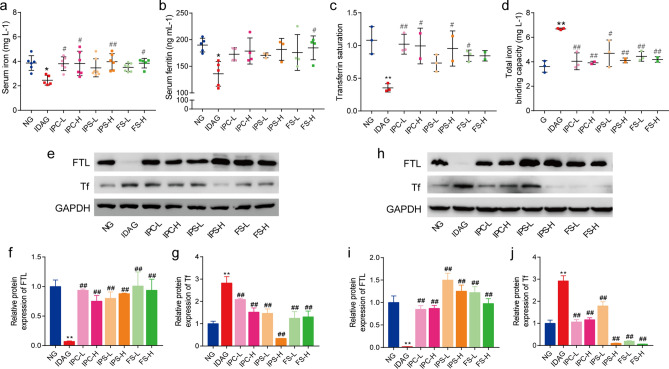
Figure 3.
Iron related indexes of maternal rats after iron supplement treatment. The serum of maternal rats was collected and tested. (a) SI. (b) SF. (c) TS. (d) TIBC. Data are presented as mean ± SD (n = 6). Western blot analysis for FTL and Tf in liver (e–g) and spleen (h–j). The quantification of western blotting was provided in supplementary material. Data of Western blot analysis (mean ± SD) are expressed as the ratio of the relative contents between the value from IDA group and NG group and six iron treatment groups (n = 3). The relative contents of target proteins were quantified using the ratio between the optical density (OD) of target protein and the amount of the housekeeping protein GAPDH. SI serum iron, SF serum ferritin, TS transferrin saturation, TIBC total iron binding capacity, FTL ferritin light chain, Tf transferrin. *p < 0.05, **p < 0.01, compared with NG, #p < 0.05, ##p < 0.01, compared with IDAG. One-way ANOVA followed by Tukey multiple comparison test was used for comparison among 8 different groups.

