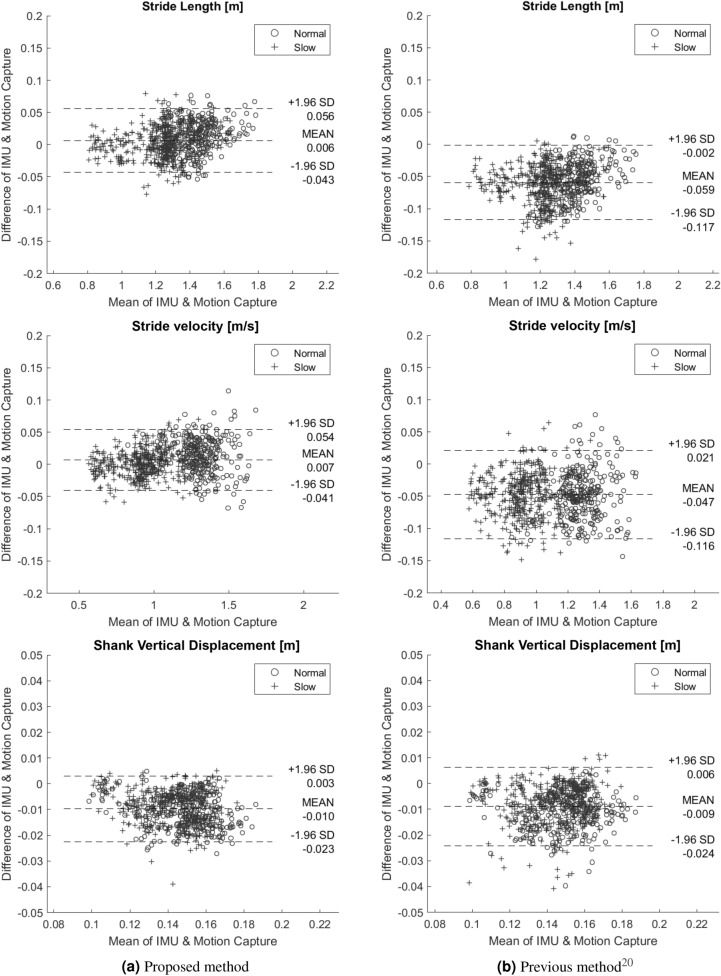
Figure 2.
Bland–Altman plot for stride length, stride velocity, and shank vertical displacement estimated by (a) the proposed method and (b) the previous method20 for 283 strides under the normal speed task () and 412 strides under the slower speed task (+). The Bland–Altman plot provides information about the mean difference, which indicates the bias between two systems, and the 95% confidence interval, which is known as the limit of agreement (LOA) that shows the difference between the values measured by two systems for most individuals27.

