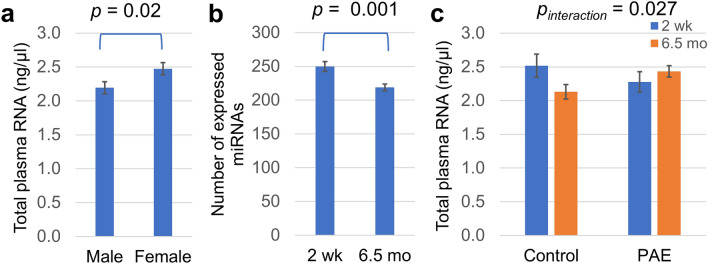
Figure 1.
RNA and miRNA content in infant plasma samples. (a) Female and male assessed plasma RNA content, determined by multiplying isolated RNA concentration by total plasma volume. (b) The total number of expressed plasma miRNAs, i.e., miRNAs with detected CT, at T2wk and T6.5mo. (c) Association between plasma RNA concentration, PAE status, and infant age. For (a) and (b), t-test p-values are shown. For (c), the p-value shown is for the interaction between age and exposure group resulting from a two-way ANOVA.

