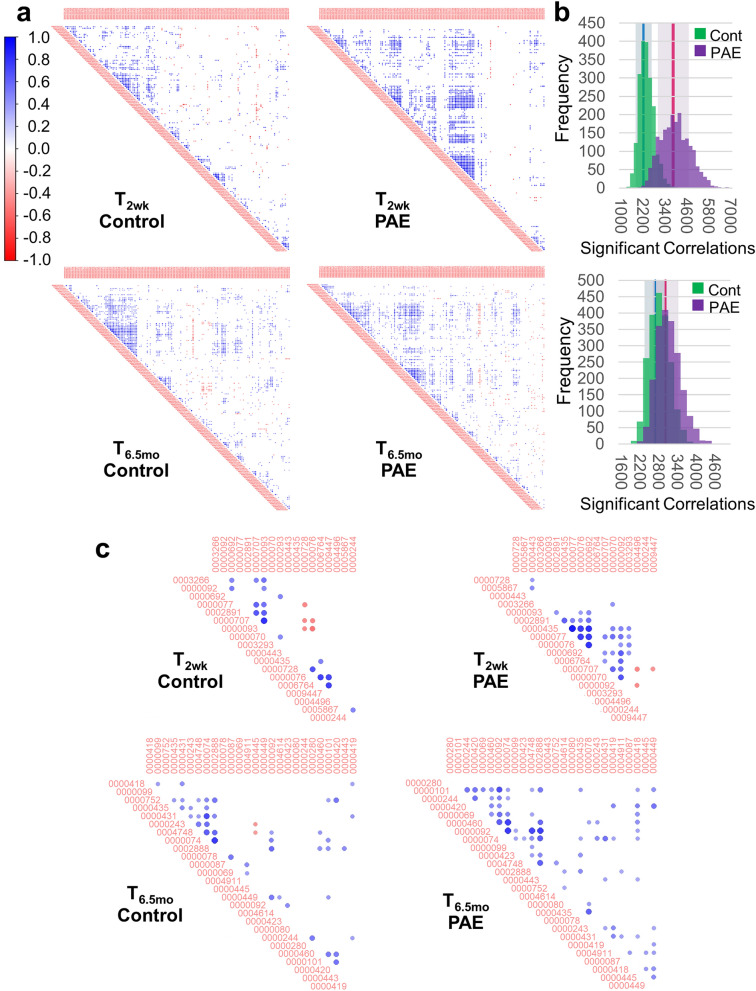
Figure 4.
exmiRNAs are highly correlated in PAE infants at T2wk. (a) Hierarchically clustered correlation plots of significant (p < 0.05) exmiRNA cross correlations. (b) Bootstrap resampling to assess the stability of the number of correlations at T2wk (top)and T6.5mo (bottom). The standard deviation of each distribution are shown by the shaded regions and 99% confidence intervals are shown by the blue (control) and pink (PAE) regions. (c) Hierarchically clustered correlation plots of significant (p < 0.05) exmiRNA cross correlations for exmiRNAs with an effect size ≥ 0.40. Figures (a) and (c) were constructed using the corrplot package (version 0.77, https://cran.r-project.org/web/packages/corrplot/index.html) for R (version 3.6.1) and figure (b) was constructed using Excel.

