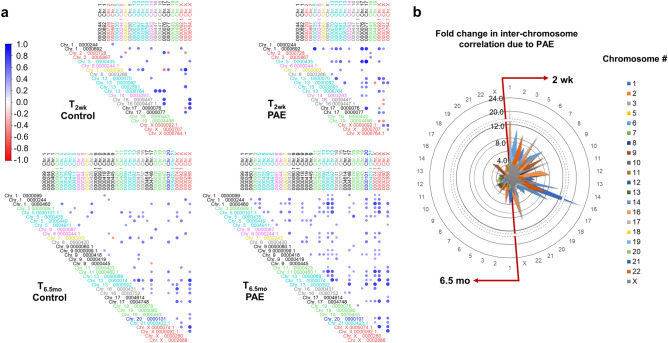
Figure 5.
Coordinated expression of exmiRNAs across chromosomes. (a) Cross correlation of exmiRNA expression, arranged by chromosomal location, at T2wk and T6.5mo for exmiRNAs with an effect size ≥ 0.40. Individual miRNAs are denoted with MIMAT number and chromosomal location, with “.1” indicative of a chromosomal duplication of the primary miRNA. For corresponding miRNA names, see Table 2. (b) From the full correlation matrices (see Supplementary Fig. S3), we assessed the fold-change difference in the number of significant correlations between chromosomes per number of expressed exmiRNA on each chromosome. Radar plot shows the enrichment of inter-chromosomal correlation in PAE infants compared to control infants at T2wk (right) and T6.5mo (left). Figure (a) was constructed using the corrplot package (version 0.77, https://cran.r-project.org/web/packages/corrplot/index.html) for R (version 3.6.1) and figure (b) was constructed using Excel.

