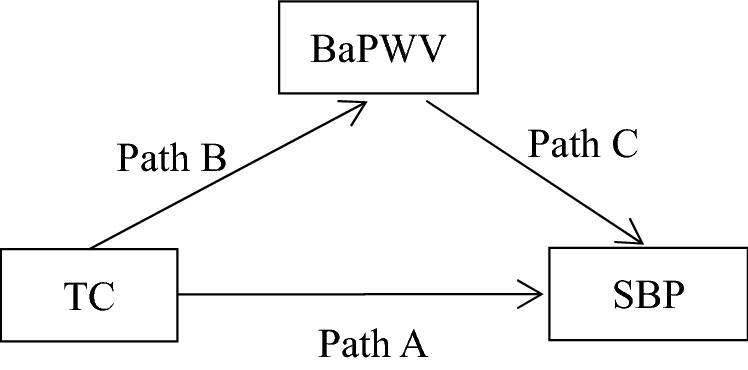
Table 3.
Mediation effect of BaPWV in the association between TC levels and SBP.
| Group | Total effect | Direct effect (Path A) |
Indirect effect (Path BC) |
Percent mediation (%) | |
|---|---|---|---|---|---|
| Model 1 | Total | 1.60 (1.47–1.73) | 0.21 (0.11–0.31) | 1.39 (1.10–1.81) | 86.9 |
| Female | 1.61 (1.31–1.90) | 0.091 (− 0.13–0.31) | 1.52 (0.70–4.13) | 94.4 | |
| Male | 1.68 (1.47–1.90) | 0.50 (0.32–0.68) | 1.18 (1.00–1.36) | 70.2 | |
| Model 2 | Total | 1.34 (0.85–1.83) | 0.60 (0.20–1.00) | 0.73 (0.43–1.01) | 54.5 |
| Female | 0.57 (− 0.41–1.52) | 0.041 (− 0.71–0.84) | 0.52 (− 0.14–1.20) | 91.2 | |
| Male | 1.46 (0.88–1.97) | 0.75 (0.28–1.22) | 0.70 (0.41–1.03) | 47.9 | |
Model 1: Unadjust.
Model 2: Adjust age, gender (in total), waist circumference, fasting blood glucose, physical exercise, smoking, alcohol consumption, heart rate, antihypertension, glucose-lowering treatment.
