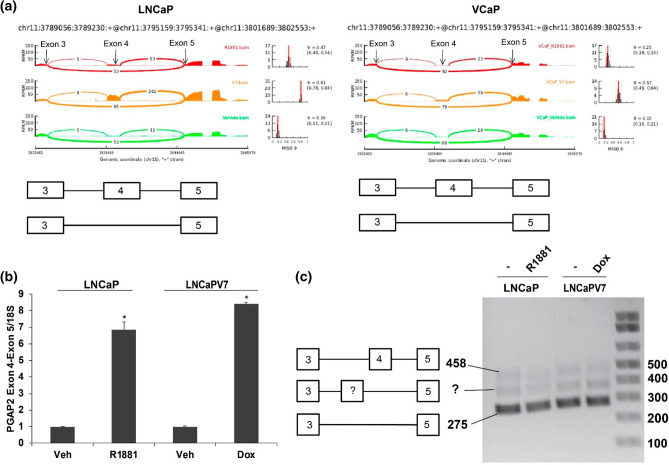
Figure 3.
Skipped exon event in PGAP2. (a) Sashimi plots for PGAP2 inclusion/exclusion of exon 4 in the LNCaP and VCaP models. To analyze the expression of the included and excluded forms, LNCaP and LNCaP-AR-V7 cells were transferred to CSS medium and treated with vehicle, R1881, or Dox for 24 h, and RNA was isolated. (b) qPCR analysis of the region encompassing Exon 4 and 5 (long isoform) in the LNCaP model showed the expected increase in expression. Expression values were plotted as a mean of three biological replicates from the same experiment. Error bars represent SEM. Asterisks (*) signify values that differed significantly with respect to vehicle (P < 0.05 in Student's t-test). (c) Agarose gel analyses of products amplified using one primer in exon 3 and one in exon 5. The bottom band of 275 bp represents the excluded form; the top band 458 bp represents long (Exon 4 included) form. There is an additional intermediate band suggesting that there is an additional sequence, which may represent an unknown exon.

