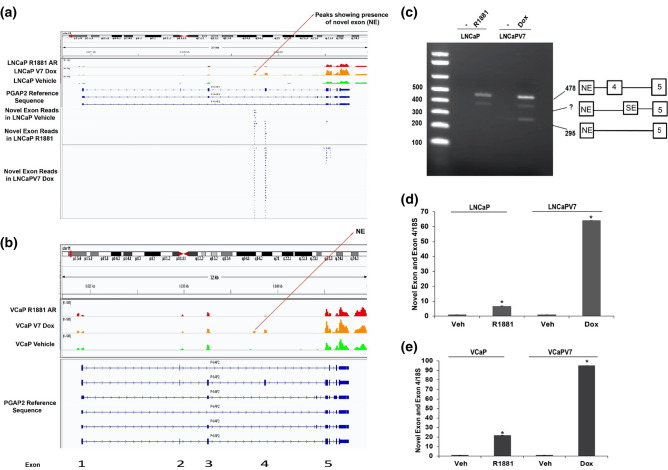
Figure 4.
A novel exon exists between exons 3 and 4. (a) IGV plot showing the presence of Novel Exon (NE) reads in PGAP2 in the LNCaP cell line and locations of sequence overlap containing a portion of the novel exon. (b) IGV peak reads of PGAP2 in the VCaP model also shows a transcribed region between exons 3 and 4. (c) Semi-quantitative PCR spanning Novel Exon (NE) and exon 5. The 295 bp band is the excluded form and the top band (478 bp) is the long (Exon 4 included) form. The middle band may correspond to the novel exon linked to another skipped exon between exons 4 and 5 linked to exon 5. (d, e) qPCR validation of novel exon linked to Exon 4 in LNCaP and VCaP models respectively.

