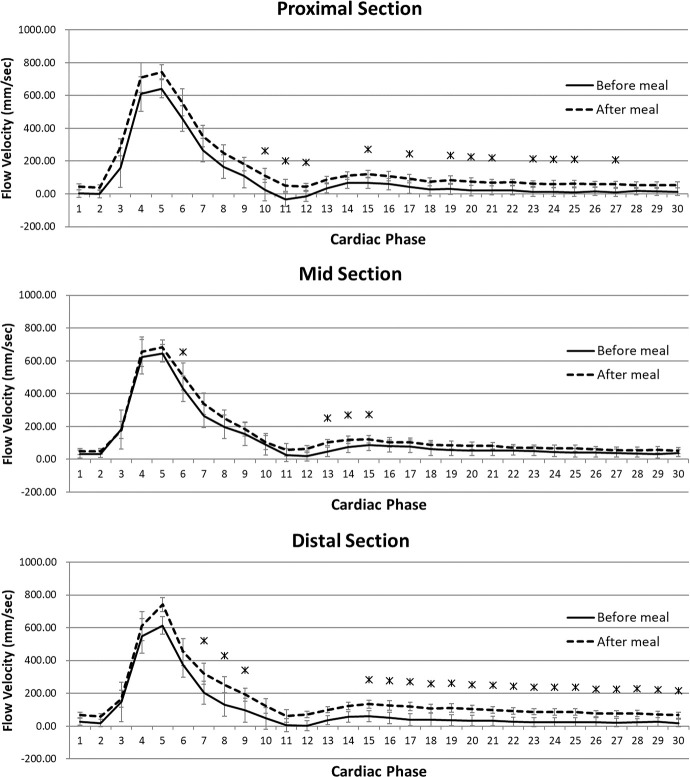
Fig. 3.
Graphs show phase resolved blood flow velocity measured at each plane with 2D cine PC MRI before and after meal challenge (Averaged values). Most of the significant increase of the flow velocities at each phase points are detected mainly at distal straight section, whereas least increase are seen at the curved mid section. *Significant increase of flow velocity (P < 0.05).

