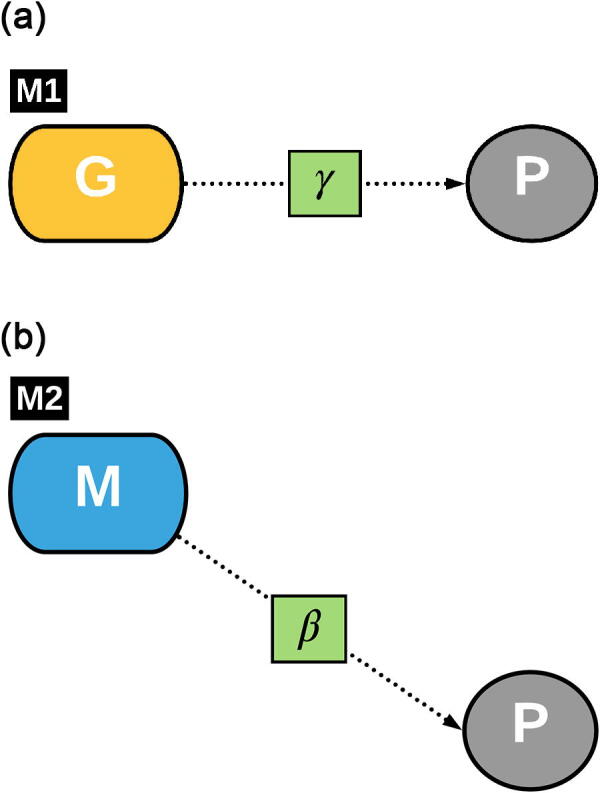
Fig. 1ab.

Graphical representations of the first two models used in this study. Model M1 estimates the total effect of G (host genomic features) on P (host phenotypes). Model M2 estimates the effect of M (gut microbial features) on P (host phenotypes).
