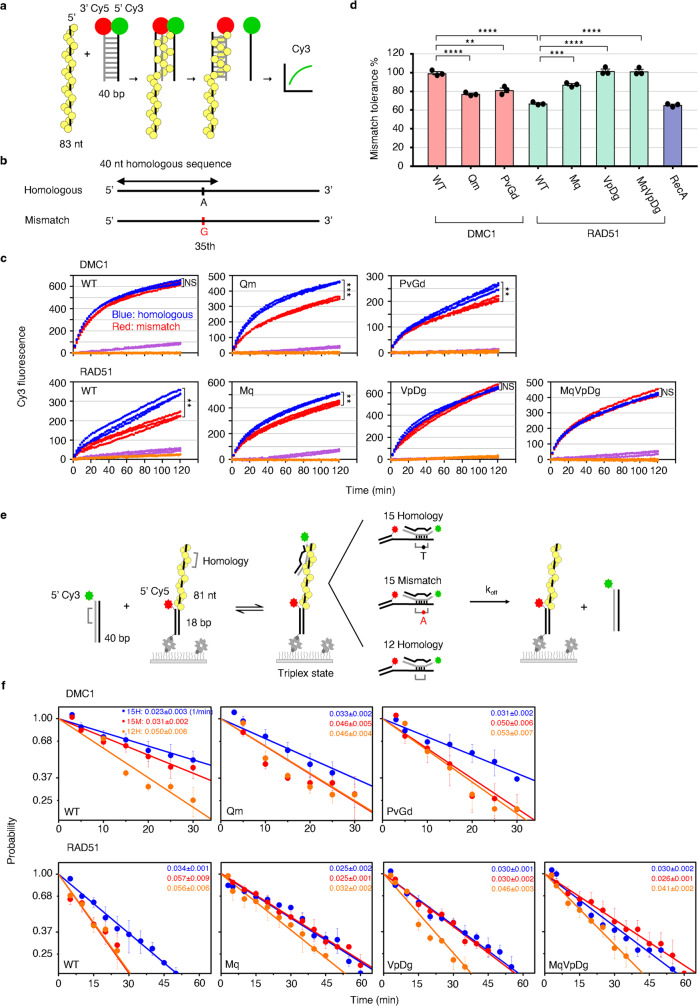
Fig. 4. Functional analysis of the mismatch tolerability of DMC1 and RAD51 variants for Loop 1 and Loop 2 residues.
a Schematics of fluorescence-based DNA strand exchange. Yellow balls represent the recombinase from filaments on ssDNA. Red and green balls represent Cy5 and Cy3 fluorophores, respectively, at the end of donor dsDNA. b Design diagram of homologous and mismatched substrates. c Cy3 fluorescence signals generated by DMC1, RAD51, and their mutant variants-mediated strand-exchange activity with homologous or mismatch substrates were monitored in real time. Blue and red dots represent the Cy3 fluorescence spectra from the homologous and mismatch substrates, respectively, while purple and orange dots represent the nonhomologous substrate with ATP and homologous substrate without ATP, respectively. Data shown are from three independent experiments. Statistics was performed by two-sides repeated-measure ANOVA (NS, not significant, **P < 0.01 and ***P < 0.001). The P-values of DMC1-WT, Qm, and PvGd are 0.0757, <0.001, and 0.005, respectively, whereas for RAD51-WT, Mq, VpDg, and MqVpDg are 0.007, 0.003, 0.224, and 0.806, respectively. d Bar plots for the percentage of mismatch tolerance determined by the final fluorescence intensity of mismatch substrate relative to homologous substrate at 120 min. Data shown are average values (mean) ± SEM from three independent experiments (n = 3). Statistics were performed by one-way ANOVA with Tukey’s post hoc test (**P < 0.01, ***P < 0.001, ****P < 0.0001). The P-values of DMC1-WT vs. PvGd and RAD51-WT vs. Mq are 0.0012 and 0.0003, respectively, whereas that of the rest are <0.0001. e Experimental design of single-molecule fluorescence colocalization to determine the stability of the recombinase-mediated triplex state. f Dissociation of the triplex state as a function of time upon removal of excess duplex strand. Three different DNA substrates (15 nt homo, 15 nt mismatch, and 12 nt homo) were determined. Slopes of the plots are the dissociation rates (min−1), which are shown within each panel by blue, red, and orange texts for the 15 nt homo (15H), 15 nt mismatch (15M), and 12 nt homo (12H), respectively. Data (mean ± SEM) are from at least three independent experiments (n = 3, except for DMC1-PvGd-12H, n = 4; RAD51-WT-15M, and 12H, n = 5). Raw data are provided in the Source Data file.

