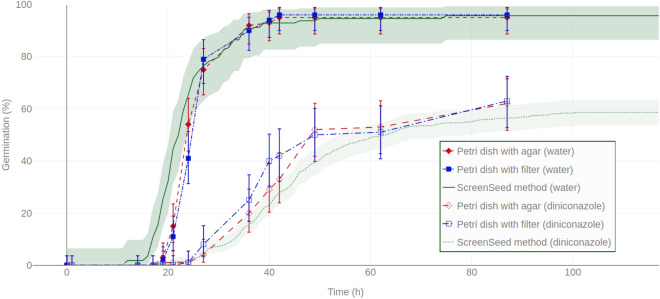
Figure 4.
Comparison of seed germination kinetics obtained with the ScreenSeed robot and standard visual-based methods. Germination kinetic curves obtained with ScreenSeed phenotyping tools (line and dots for water and diniconazole conditions respectively) are compared to standard methods (visual monitoring of seed germination) in Petri dishes using filter paper (square) or agar medium (diamonds), in water (filled symbols) or in diniconazole (empty symbols), respectively. Shaded areas around the curves obtained using ScreenSeed technology represent the 90% confidence intervals matching Fisher Exact test as described in50. For standard methods by visual scoring in Petri dishes, the average of 4 blocks of replicates is shown with error bars representing the 90% Fisher Exact test confidence interval. As described in Supplementary Data S4 online, 100 seeds have been used for Petri dishes conditions. Regarding observation from the ScreenSeed robot, 55 seeds for the non treated (water) condition and 404 seeds for the diniconazole conditions were observed respectively.

