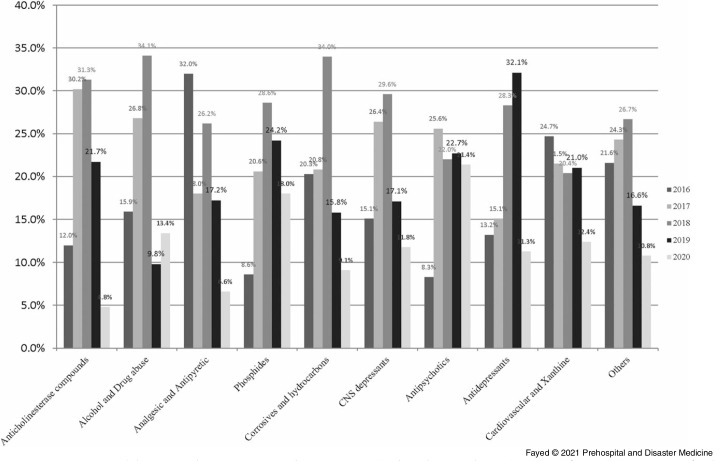
Figure 3.
Proportions of Causative Agent Exposure According to the Age Groups Over the Period (March through May) of 2016-2020.
Abbreviation: CNS, Central Nervous System.
Anticholinesterase compounds exposure presented as follows: 2016 (12.0%), 2017 (30.2%), 2018 (31.3%), 2019 (21.7%), and 2020 (4.8%).
Alcohols and drugs of abuse exposure presented as follows: 2016 (15.9%), 2017 (26.8%), 2018 (34.1%), 2019 (9.8%), and 2020 (13.4%).
Analgesic antipyretic exposure presented as follows: 2016 (32.0%), 2017 (18.0%), 2018 (26.2%), 2019 (17.2%), and 2020 (6.6%).
Phosphide exposure presented as follows: 2016 (8.6%), 2017 (20.6%), 2018 (28.6%), 2019 (24.2%), and 2020 (18.0%).
Corrosives and hydrocarbons exposure presented as follows: 2016 (20.3%), 2017 (20.8%), 2018 (34%), 2019 (15.8%), and 2020 (9.1%).
CNS depressants exposure presented as follows: 2016 (15.1%), 2017 (26.4%), 2018 (29.6%), 2019 (17.1%), and 2020 (11.8%).
Antipsychotics exposure presented as follows: 2016 (8.3%), 2017 (25.6%), 2018 (22.0%), 2019 (22.7%), and 2020 (21.4%).
Antidepressants exposure presented as follows: 2016 (13.2%), 2017 (15.1%), 2018 (28.3%), 2019 (32.1%), and 2020 (11.3%).
Cardiovascular and xanthine derivatives exposure presented as follows: 2016 (24.7%), 2017 (21.5%), 2018 (20.4%), 2019 (21.0%), and 2020 (12.4%).
Other non-classified toxic exposure presented as follows: 2016 (21.6%), 2017 (24.3%), 2018 (26.7%), 2019 (16.6%), and 2020 (10.8%).

