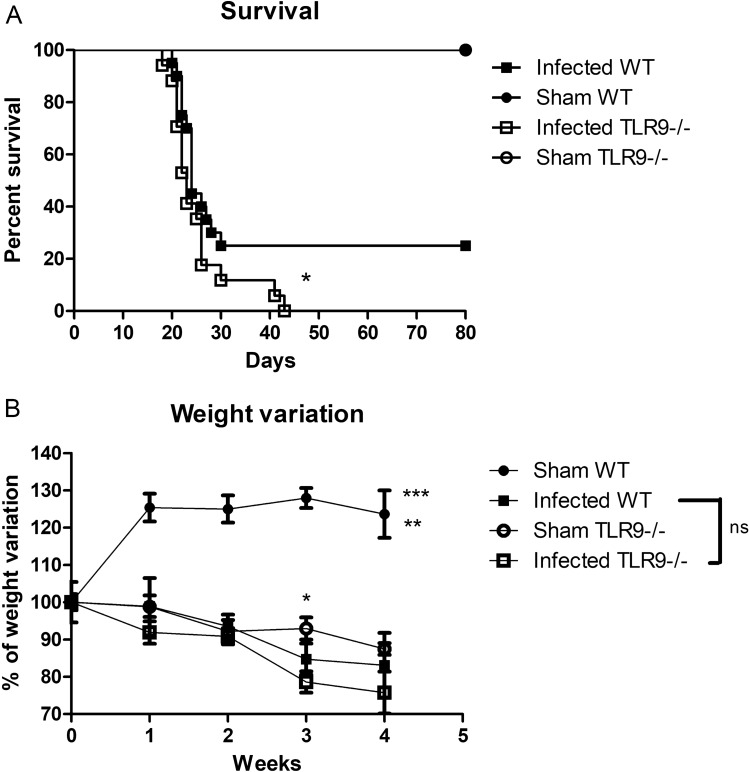
Figure 1.
Analysis of susceptibility of TLR9−/− and WT mice to C. gattii infection. (A) Survival curves of infected C57BL/6 WT (n = 20) and TLR9−/− (n = 17) mice. Mice were infected with 104 C. gattii R265 belonging to serotype IIa. Sham WT (n = 6) and TLR9−/− (n = 6) mice given with vehicle (PBS) only were used as controls. Log-rank test (Mantel-Cox test): *P ≤ 0.05. (B) The percentage change in weight of infected WT (n = 11) and TLR9−/− (n = 10) mice, as well as the Sham groups (Sham WT and Sham TLR9−/−) (n = 5 per group), was determined through weekly mass measurements over 28 days (0, 7, 14, 21 and 28 days after inoculation). Black squares represent infected WT mice, black balls represent uninfected WT mice, white squares represent infected TLR9−/− mice, and white balls represent uninfected TLR9−/− animals. One-Way ANOVA (**P ≤ 0.01) and Two-Way ANOVA with Bonferroni posttest (*P ≤ 0.05; ***P ≤ 0.001); ns = not statistically significant. Graphs show the union of the results from 4 similar and independent experiments.

