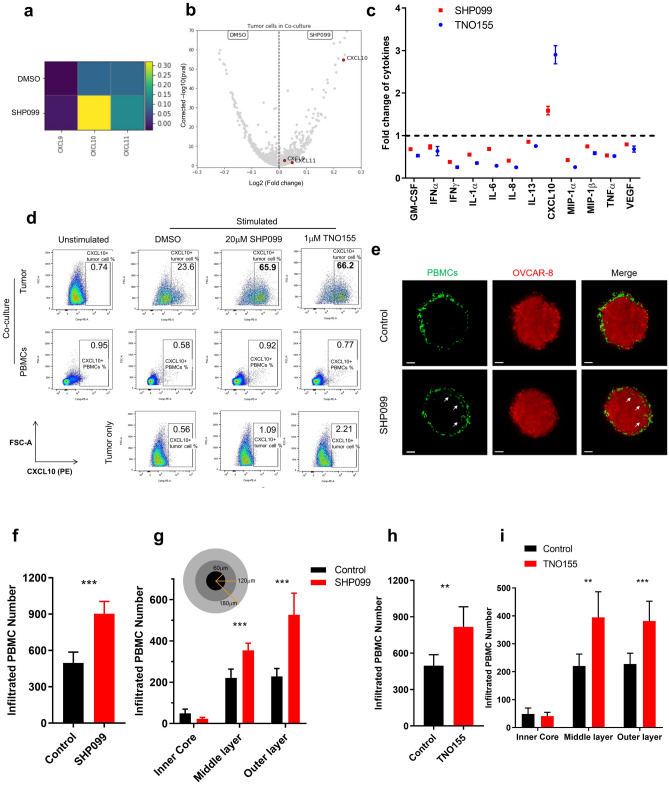
Figure 3.
SHP2 inhibition upregulates expression of CXCR3 ligands and promotes immune cell infiltration. (a) Heatmap of transcriptional expression level of CXCR3 ligand genes CXCL9, CXCL10, CXCL11 in OVCAR-8 tumor cells in co-culture from scRNAseq data. (b) Volcano plot of transcriptional expression level of CXCR3 ligand genes CXCL9, CXCL10, CXCL11 in OVCAR-8 tumor cells in co-culture from scRNAseq data. (c) Luminex analysis of TNO155 and SHP099-induced fold change of a panel of cytokines (normalized to control group) in supernatants collected from co-culture of OVCAR-8 spheroids with PBMCs. (d) Flow cytometry analysis of intracellular staining of CXCL10 from 2 days of co-culture and tumor only. CXCL10-positive cells are gated. Percentage of CXCL10-positive population is labeled. (e) Light sheet microscopy imaging of infiltrated PBMCs (Green) inside OVCAR-8 tumor spheroids (Red) after 24 h of co-culture. Scale bar: 50 μm. (f, h) Histogram of number of total infiltrated PBMCs inside tumor spheroids. (g, i) Histogram of number of infiltrated PBMCs in different layers of tumor spheroids. Flow cytometry data was analyzed and processed with FlowJo (Version 10.7.1, https://www.flowjo.com/solutions/flowjo/downloads/previous-versions).

