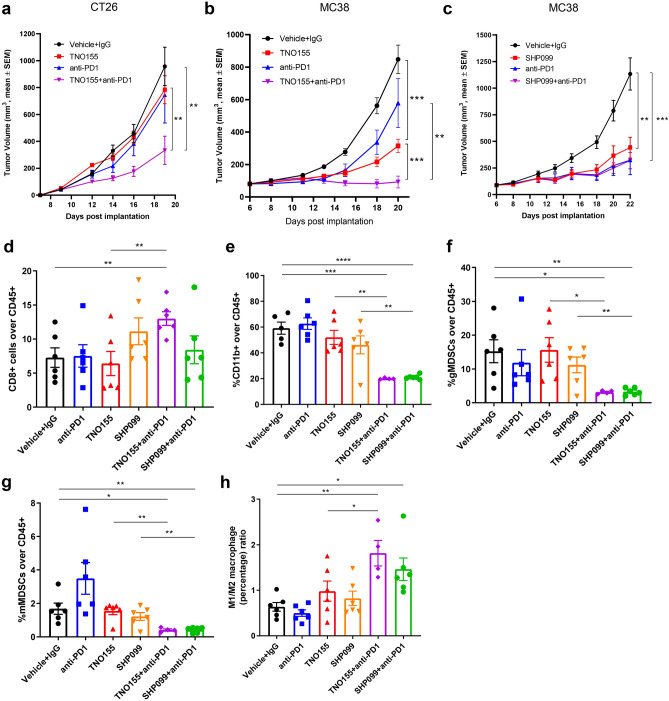
Figure 9.
SHP2 inhibition displays combination benefit with PD1 blockade. (a) Tumor growth curve (expressed as tumor volume) of subcutaneous CT26 tumors in CT26 syngeneic mice with different treatments. TNO155: 20 mg/kg, PO, BID; Anti-PD1: 10 mg/kg, IP, QW. (b, c) Tumor growth curve (expressed as tumor volume) of subcutaneous MC38 tumors in MC38 syngeneic mice with different treatments. Mice were treated with Vehicle + IgG, anti-PD1, TNO155 and TNO155 + anti-PD1 in (b); Mice were treated with Vehicle + IgG, anti-PD1, SHP099 and SHP099 + anti-PD1 in (c); TNO155: 20 mg/kg, PO, BID; SHP099: 100 mg/kg, PO, QD; Anti-PD1: 10 mg/kg, IP, QW. (d) Flow cytometry analysis of the percentage of CD8+ T cells over CD45+ immune cells in MC-38 syngeneic model. (e) Flow cytometry analysis of the percentage of CD11b+ myeloid cells over CD45+ cells in MC-38 syngeneic model. (f) Flow cytometry analysis of the percentage of gMDSCs over CD45+ cells in MC-38 syngeneic model. (g) Flow cytometry analysis of the percentage of mMDSCs over CD45+ cells in MC-38 syngeneic model. (h) Flow cytometry analysis of the percentage ratio of M1 macrophage over M2 macrophage in MC-38 syngeneic model. Flow cytometry data was analyzed and processed with FlowJo (Version 10.7.1, https://www.flowjo.com/solutions/flowjo/downloads/previous-versions).

