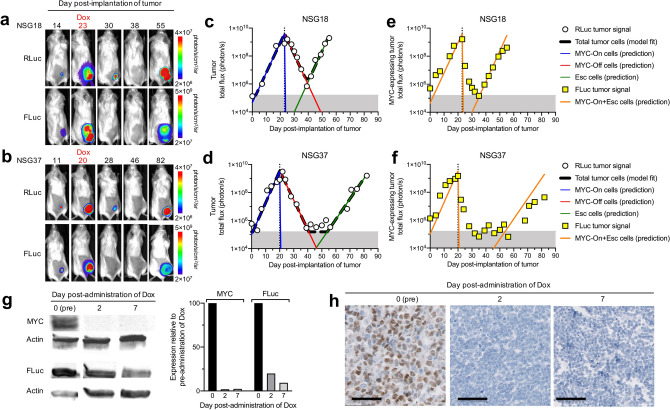
Figure 2.
Modeling in vivo bioluminescence imaging (BLI) measurements of tumor burden in mice with recurring tumors. (a, b) BLI of PGK-RLuc and Tet-FLuc signals in two representative NSG mice treated with doxycycline (Dox) on (a) day 23 or (b) day 20 after tumor transplantation. (c–f) Quantitative analysis of the RLuc and FLuc signals from (a, b). (c, d) The simplified 3-compartment model was fitted (dashed black line) to RLuc signal (white circles), shown superimposed with the predicted population of MYC-On cells (blue line), MYC-Off cells (red line), and Escaped cells (green line). Shaded grey region (below 1.60 × 10⁵ photon/s) indicates imaging signal is below the limit of detection. (e, f) The model-predicted MYC-expressing tumor cell population (orange line) superimposed with Tet-FLuc signal (yellow squares). (g) Western blot of MYC and FLuc protein expression in the tumors collected before, or 2 or 7 days after MYC inactivation. (h) Immunohistochemistry staining of MYC in the tumors collected before, or 2 or 7 days after MYC inactivation. Scale bar is 50 µm.

