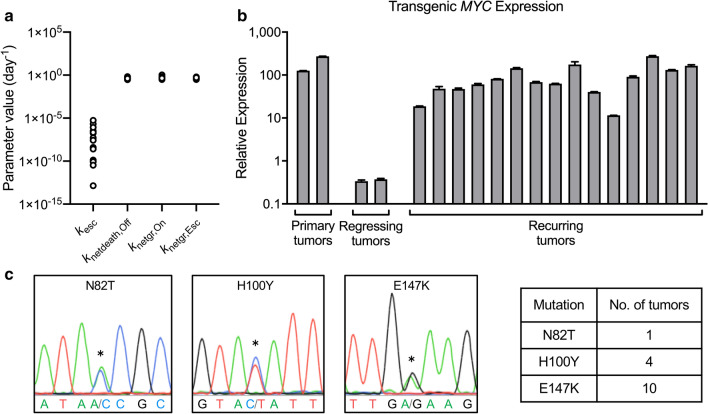
Figure 3.
Quantitative analysis of tumor growth, death, and escape rates and associated tTA mutations. (a) Summary of parameter estimates from n = 15 mice with tumor recurrence: kesc (day−1), knetdeath,Off (day−1), knetgr,On (day−1), knetgr,Esc (day−1). (b) Transgenic MYC expression measured by qPCR showed that every recurring tumor exhibited high transgenic MYC expression. (c) Example chromatograms and table summarizing the N82T, H100Y and E147K mutations detected in the recurring tumors.

