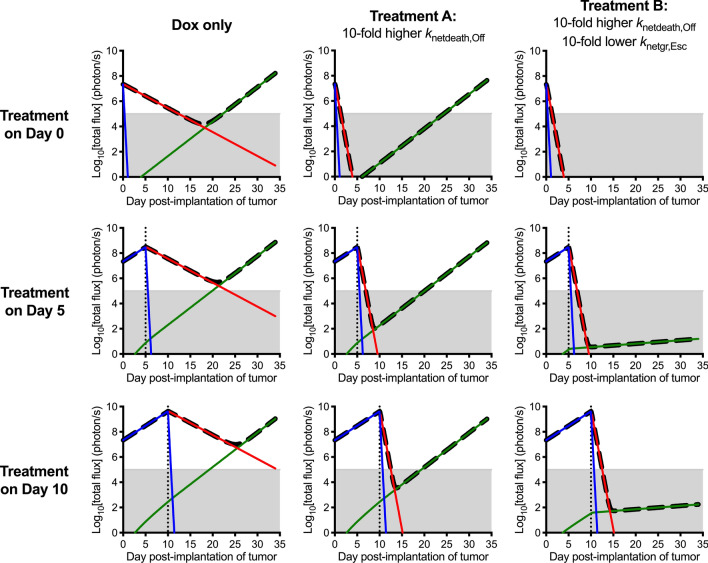
Figure 6.
Comparison of doxycycline (Dox) treatment to two hypothetical treatments for a simulated lesion of 1 × 10⁷ T-ALL cells. Shown are the MYC-On (blue), MYC-Off (red), and Escaped (green) cell populations following a one-time treatment dosing on the indicated day. Shaded grey region indicates tumor burden not detectable with imaging. Treatment A has a tenfold higher knetdeath,Off relative to Dox, and Treatment B has a tenfold higher knetdeath,Off and tenfold lower knetgr,Esc relative to Dox.

