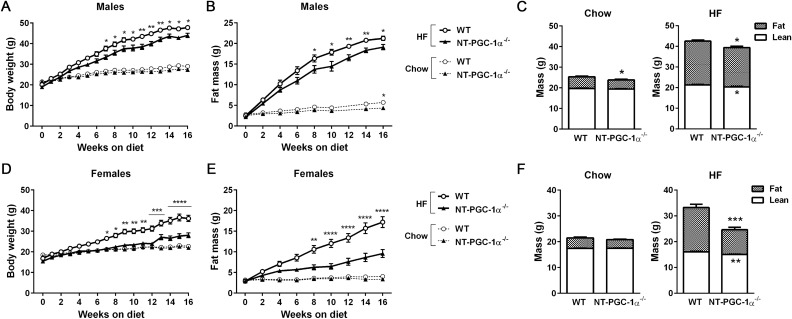
Figure 1.
Analysis of the effects of NT-PGC-1α ablation on diet-induced obesity. (A,B) Measurements of body weight and fat mass of male WT and NT-PGC-1α−/− mice during chow (n = 11 per group) or HFD (n = 12 per group) feeding. Two-way ANOVA was used to determine the differences between the genotypes. BW: F (1, 24) = 9.726, P = 0.0048; FM: F (1, 22) = 5.939, P = 0.0234 in HFD-fed group. BW: F (1, 22) = 3.485, P = 0.0753; FM: F (1, 20) = 5.843, P = 0.0253 in chow-fed group. (C) Body composition of male WT and NT-PGC-1α−/− mice after 16 weeks of either chow- or HFD-feeding. Data are presented as the mean ± SEM. *P < 0.05 determined by Student’s t test. (D,E) Body weight and fat mass of female WT and NT-PGC-1α−/− mice during chow (n = 11 per group) or HFD (n = 12 per group) feeding. Two-way ANOVA was used to determine the differences between the genotypes. BW: F (1, 24) = 20.50, P = 0.0001; FM: F (1, 22) = 21.34, P = 0.0001 in HFD-fed group. BW: F (1, 22) = 0.7853, P = 0.3851; FM: F (1, 20) = 2.426, P = 0.1350 in chow-fed group. (F) Body composition of female WT and NT-PGC-1α−/− mice after 16 weeks of either chow- or HFD-feeding. Data are presented as the mean ± SEM. **P < 0.01, ***P < 0.001 determined by Student’s t test.

