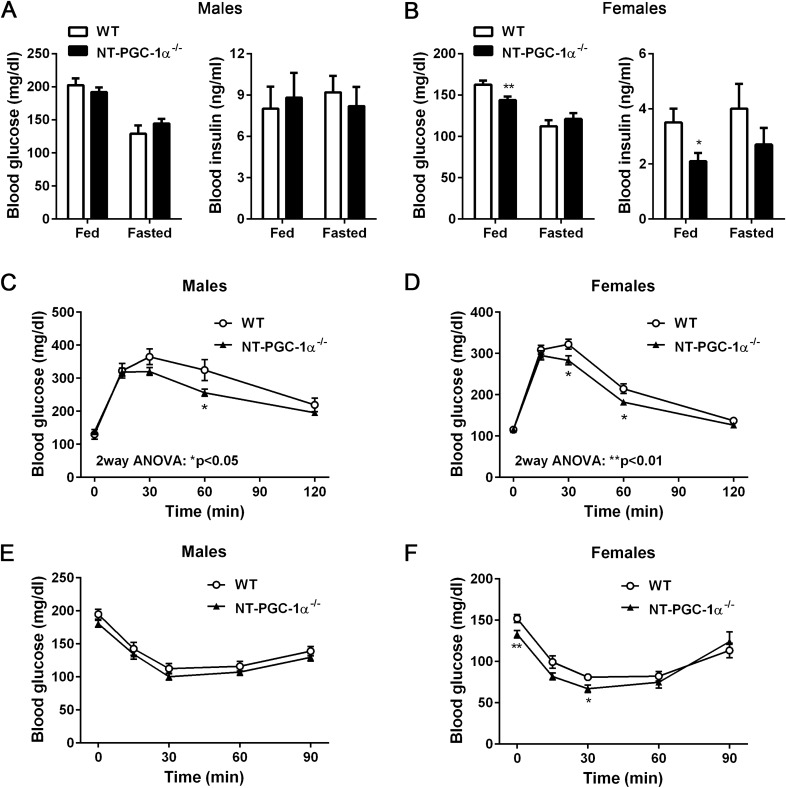
Figure 2.
Whole body glucose homeostasis in NT-PGC-1α−/− mice fed HFD. (A,B) Blood glucose and insulin levels in HFD-fed male and female WT and NT-PGC-1α−/− mice in the fed and fasted states (n = 9 per group). Data are presented as the mean ± SEM. *P < 0.05, **P < 0.001 determined by Student’s t test. (C,D) Glucose tolerance test in male and female WT and NT-PGC-1α−/− mice fed HFD for 9 weeks (n = 11–12 per group) in the overnight-fasted state. Two-way ANOVA was used to determine the differences between the genotypes. Males: F (1, 105) = 6.009, P = 0.0159; females: F (1, 110) = 11.15, P = 0.0011. (E,F) Insulin tolerance test in male and female WT and NT-PGC-1α−/− mice fed HFD for 10 weeks in the 5 h-fasted state (n = 11–12 per group).

