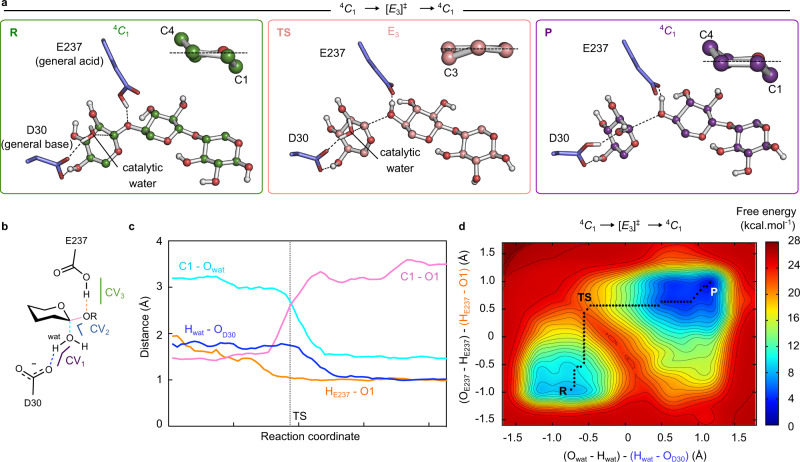
Fig. 8. The 4C1 → [E3]ǂ → 4C1 catalytic itinerary.
a Representative snapshots of the reactant (R) transition state (TS) and product (P) states of the catalytic itinerary. A zoom of the −1 sugar conformation is represented at the top right of each state. b Schematic representation of catalytically relevant distances and collective variables (CV1, CV2, and CV3) (wat = catalytic water). The CV1 (purple) corresponds to the difference between Owat-Hwat and Hwat-OAsp30 distances. The CV2 (blue) was taken as the difference between C1xylosyl–O4xylosyl and Owat–C1xylosyl distances. The CV3 (green) was taken as the difference between OGlu237-HGlu237 and HGlu237-O1xylosyl distances. c Evolution of these distances represented in b (running averages over five data points) along the reaction pathway. The distance between HE237 – O1 is represented in orange, the distance between Hwat – OD30 in blue, C1-Owat in cyan and the glycosidic bond (C1-O1) in pink. d FEL of the catalytic reaction starting from 4C1, projected into CV1 ((Owat-Hwat) – (Hwat-OAsp30)) and CV3 ((OGlu237-HGlu237) – (HGlu237-O1xylosyl)). The corresponding 3D FEL is shown in Supplementary Fig. 10. The minimum free energy pathway is indicated with a black dashed line on the two-dimensional FEL. Isolines are at intervals of 1 kcal mol−1. Source data are provided as a source data file.

