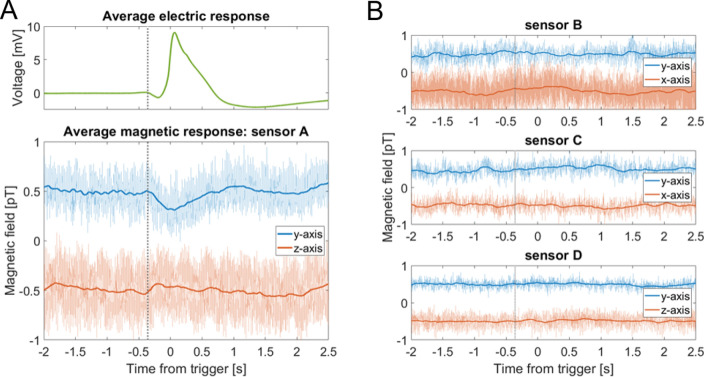
Figure 4.
Average action potential and corresponding magnetic signals. (A) Result of triggering on nine consecutive APs from a trap lobe heated to 41 °C, then averaging the electric and magnetic data from a 4.5 s window around each trigger point. The average magnetic traces (bottom graph, opaque traces) were frequency-filtered (50 Hz low-pass), then smoothed with a 0.2 s running average. A magnetic signal is visible in both sensitive axes of the primary sensor A. For comparison, the raw unfiltered data are plotted behind the processed data. For visual clarity, DC offsets have been added to the data, and vertical gray dotted lines indicate the approximate start time of the electric signal. (B) Average magnetic response from the other three sensors, obtained using the same procedure as in (A). The data from the secondary sensors, B and C, do not show a signal. The data from the background sensor D can be used to remove noise common to all sensors (see Fig. 5).

