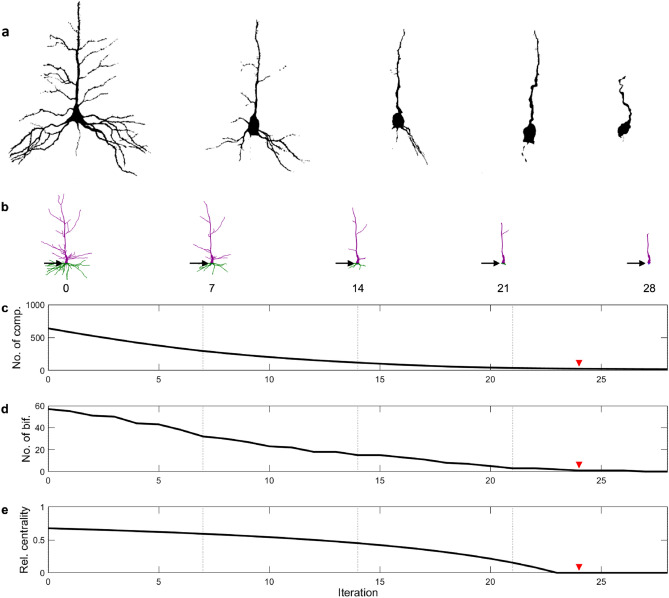
Figure 1.
Dendritic pruning and neuronal aging. (a) Human neurons in their various aging stages (adapted with permission from13). (b) Snapshots of a digitally recreated human neuron (Neuron A, see “Methods”) in various stages of simulated aging. The number below each neuron signifies the pruning iteration (see “Methods”). Basal dendrites are colored in green, while apical dendrites are colored purple. The soma (blue) is shown by the black arrow. (c) The number of compartments as a function of the pruning iteration. (d) The number of bifurcations as a function of the pruning iteration. (e) Relative centrality of the pruned neuron (see “Methods”). At the red arrow, a single dendritic branch remains, which bifurcates once at the top of the apical tree.

