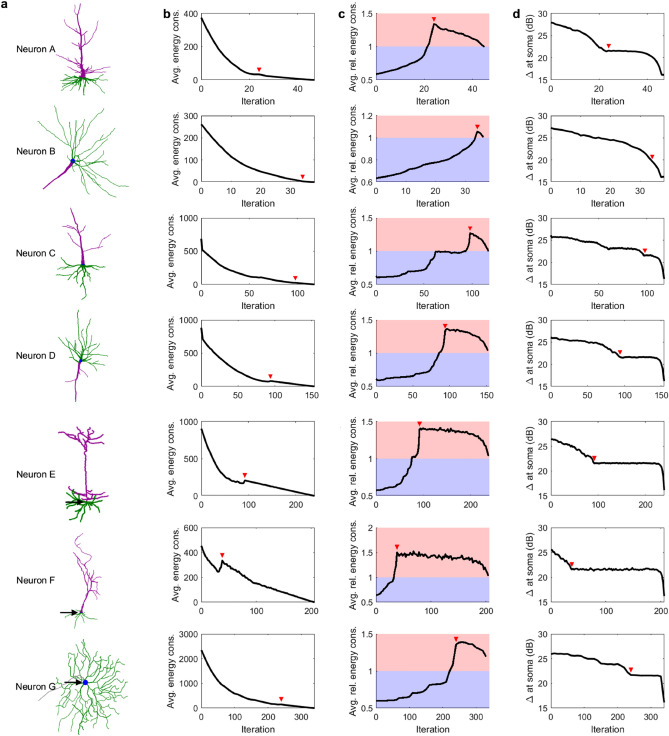
Figure 6.
Effect of aging in the dynamics of different neurons. See “Methods” and Table 1 for a detailed description of the neurons. (a) Digital recreation of intact neurons. The soma is shown in blue, basal dendrites in green, and apical dendrites in purple. (b) The total energy consumption of the neurons as a function of the pruning iteration, averaged over the parameter space and . (c) The relative energy consumption of the neuron as a function of the pruning iteration, averaged over the parameter space and . Energy efficient stages are represented by the blue region, while energy inefficient stages are represented by the red region. (d) Dynamic range at the soma for P = 0.8. The red arrows mark the iteration at which the neuron is reduced to a single branch with no bifurcations.

