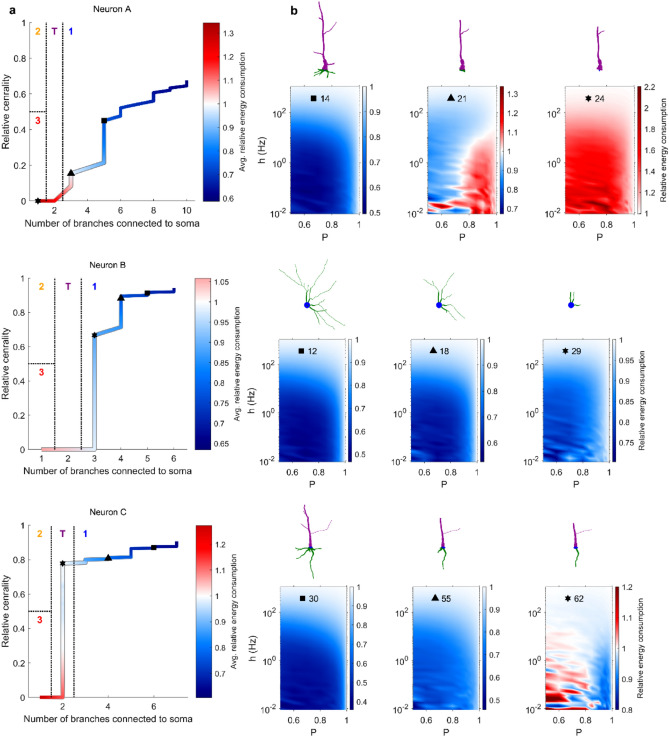
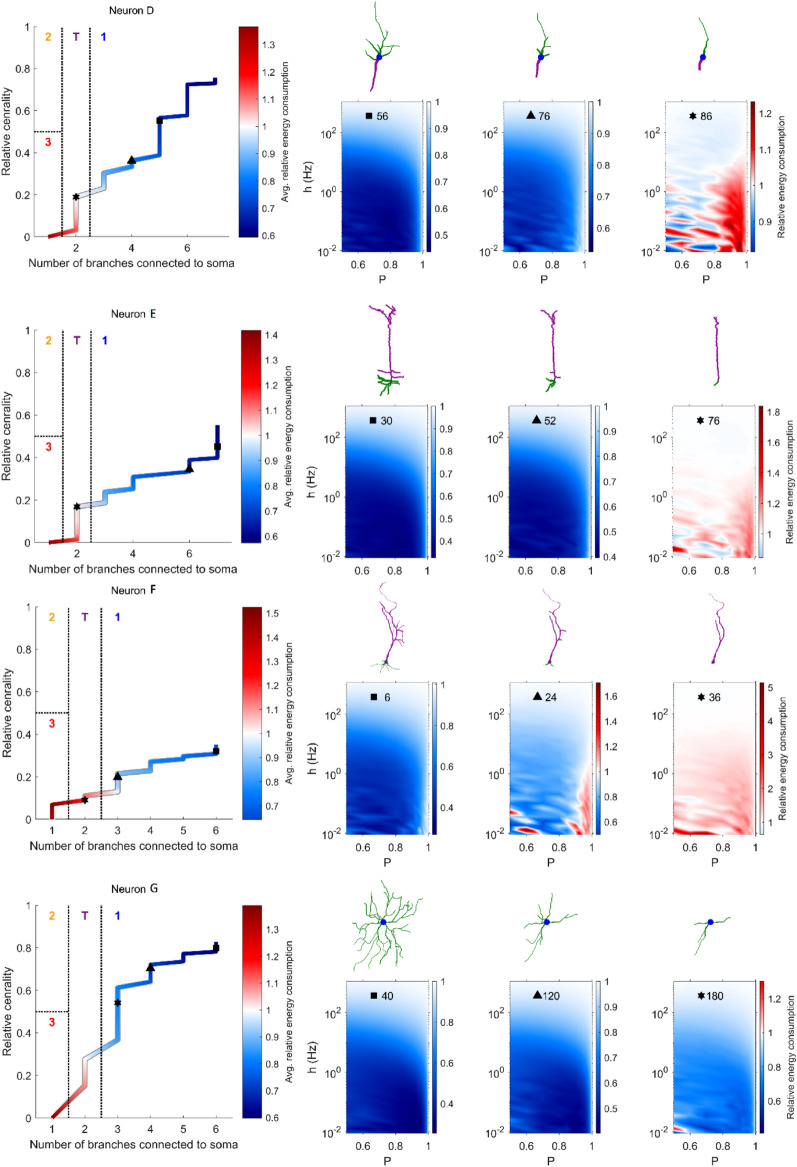
Figure 7.
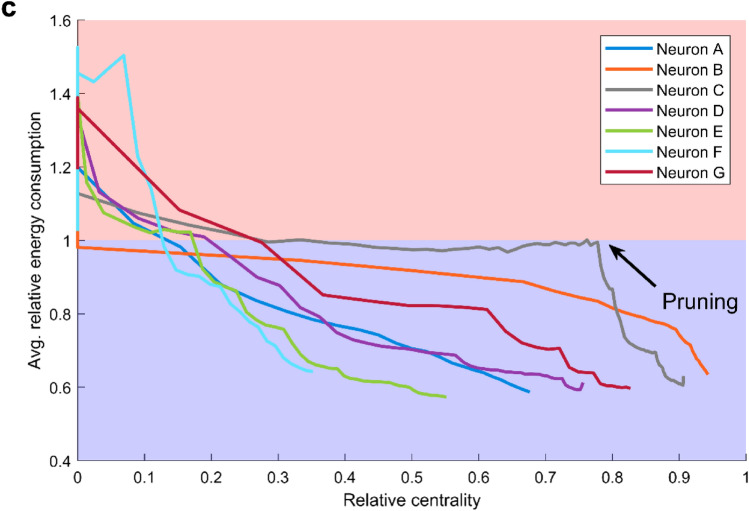
Neuronal classification scheme varies with pruning. (a) Evolution of seven neurons in the branch-centrality space that is used for classification. Color corresponds to the relative energy consumption, averaged over the parameter space and . The three symbols (square, triangle, and star) indicate the points at which snapshots are shown in panel b. (b) Snapshots of the dendritic structure and corresponding relative energy consumption profile after the specified number of pruning iterations. (c) Relative energy consumption of neurons as a function of centrality. With pruning iterations, the centrality decreases (marked by the direction of the black arrow, and also shown in Fig. 1e).


